Lab 4 - Monitoring using SRE Golden Signals
- Lab Overview
- Prerequisite
- Business Context
- Add Managed Clusters
- Deploy cloud native monitoring
- Deploy Bookinfo Application
- Deploy synthetics monitoring Point-of-Presence
- Explore SRE Golden Signals
- Summary
Lab Overview
Monitoring module of IBM Cloud Pak for Multicloud Management is a modern management platform, providing application-aware infrastructure monitoring and analysis for improved time to value. As a cloud-native application management platform, Monitoring provides the correct set of easy to use tools that meet the needs of development, operations, and site reliability engineering (SRE) teams. Tools needed to quickly find the root cause of an issue across a broad range of technologies, hybrid-cloud, and complex microservices architectures in all sorts of industries. Monitoring delivers app-centric monitoring of microservices-based applications in addition to monitoring for traditional resources across enterprises.
Monitoring module includes IBM Cloud Event Management and gives site reliability engineers (SREs) a consistent monitoring method across the enterprise to any public or private cloud. Deploy in minutes, simplify your application management with increased flexibility, and deliver on different aspects of the application modernization journey. With Monitoring, you can simplify monitoring and incident management, which helps decrease time to resolution no matter how complex the hybrid microservices-based environment.
In this tutorial, you will explore the following key capabilities:
Understand Cloud Pak for Multicloud Management Monitoring moduleLearn how to add cloud native monitoring to the managed clusterlearn how to gather monitoring metrics from the managed clusterLearn how to use SRE Golden Signals to monitor application running on the managed cluster
Prerequisite
- You need to provision your own copy of the CP4MCM 2.x environment, start it and verify for correct startup (check here).
Business Context
Companies are modernizing their applications, preparing to move them to the cloud. In this process, applications are refactored to use a microservice architecture and deployed in dynamic environments like Kubernetes. Cloud-native development is way more agile than traditional methodology, which enables changes to application structure at a rapid pace. This creates a challenge for Operation teams who must maintain those applications and provide high availability of the services. With a new version of application deployed daily or weekly, there is rarely time to create bespoke monitoring dashboards and practice the troubleshooting routines. Both people and tools have to adapt to new conditions. IBM Cloud Pak for Multicloud Management can manage Kubernetes clusters that are deployed on any target infrastructure - either in your own data center or in a public cloud. IBM Cloud Pak for Multicloud Management includes IBM Cloud App Management to simplify monitoring your applications across any cloud environment. IBM Cloud Pak for Multicloud Management helps companies make the transition from traditional monitoring systems to cloud-based ones more easily. It effectively monitors all kinds of IT resources in a hybrid environment. It helps Operation teams manage hybrid environments without hiring new personnel to support each new technology that is being used by developers. In this tutorial, you learn how to use IBM Cloud Pak for Multicloud Management to monitor and manage the application availability with a “Golden Signal” approach to monitoring your applications. This approach focuses on Latency, Errors, Traffic, and Saturation (for a quick introduction, see Simplify Application Monitoring with SRE Golden Signals).
In this tutorial, you use a Red Hat OpenShift cluster with Cloud Pak for MCM as a Management Hub and a second single-node cluster running MicroK8s as a managed cluster
- Hub cluster includes management console, federated monitoring, and all the controllers.
- Managed cluster includes klusterlet components that communicate status back to the Hub cluster.
The relationship between hub and managed clusters is shown in the diagram below:
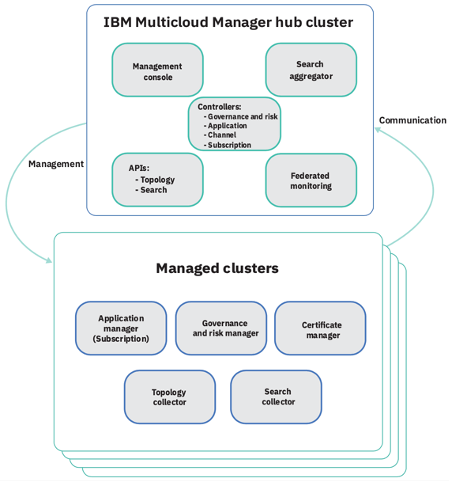
In this tutorial, you will log in to the Hub cluster and configure the Monitoring module.
You will complete the following tasks:
- Add a managed cluster (if not done already)
- Deploy cloud native monitoring to the managed cluster
- Visualize monitored resources in a managed cluster
- Install the Synthetic Monitoring Point-of-Presence
- Deploy an monitored application to managed cluster
- Define the synthetic monitoring of the application and define a Service Level Objective for it
- Explore application service topology and SRE Golden Signals provided by data collectors embeded in the application runtimes
Add Managed Clusters
In this section, you will add a managed cluster in your Control Panel. If you have done this before as a part of Cluster Management lab you may skip to the Next step
To start the lab, you should be in your Cloud Pak for Multicloud Management Web Console. If you are not, check here how to open your console page.
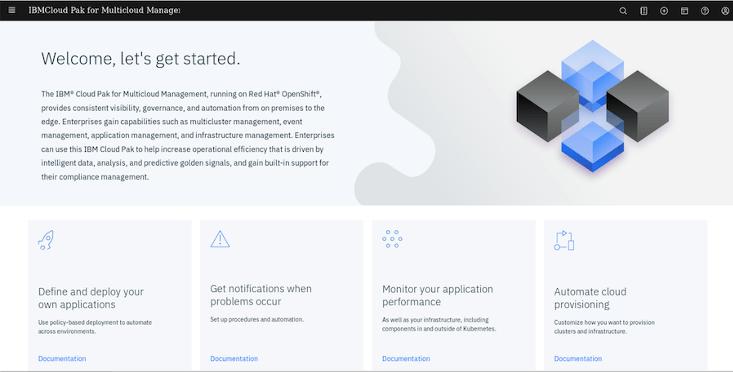
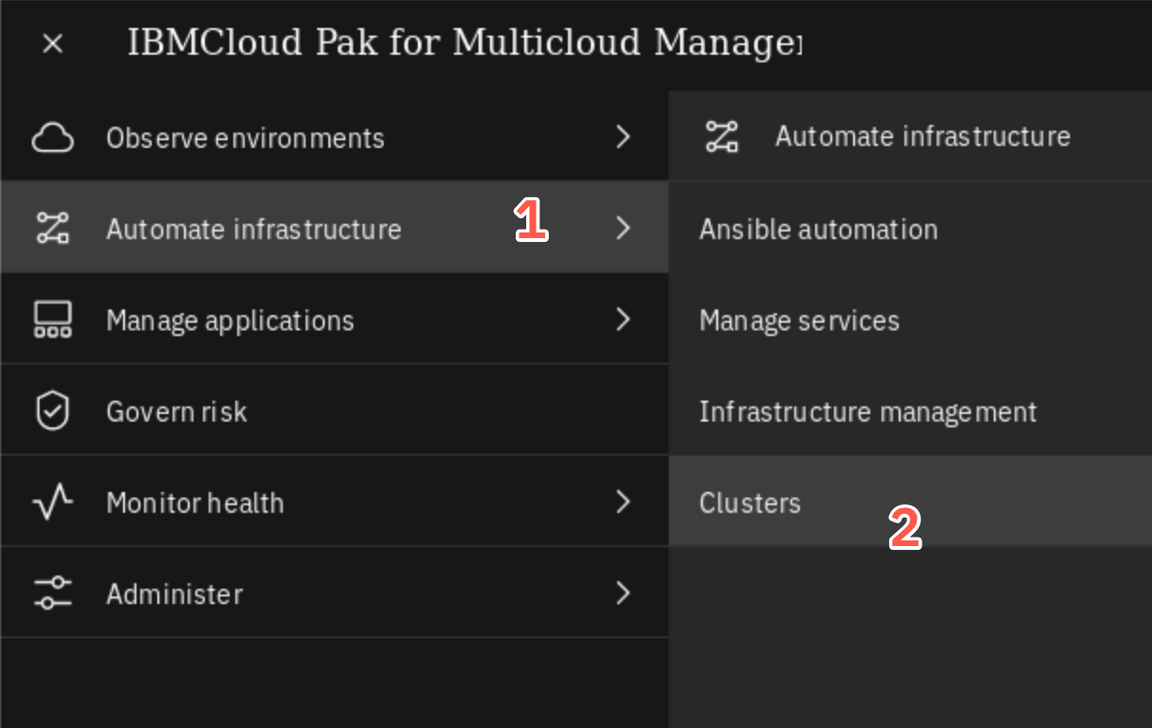
Now, let’s explore the Cluster view. Click the hamburger Menu (1) and select Automated Infrastructure -> Clusters (2).
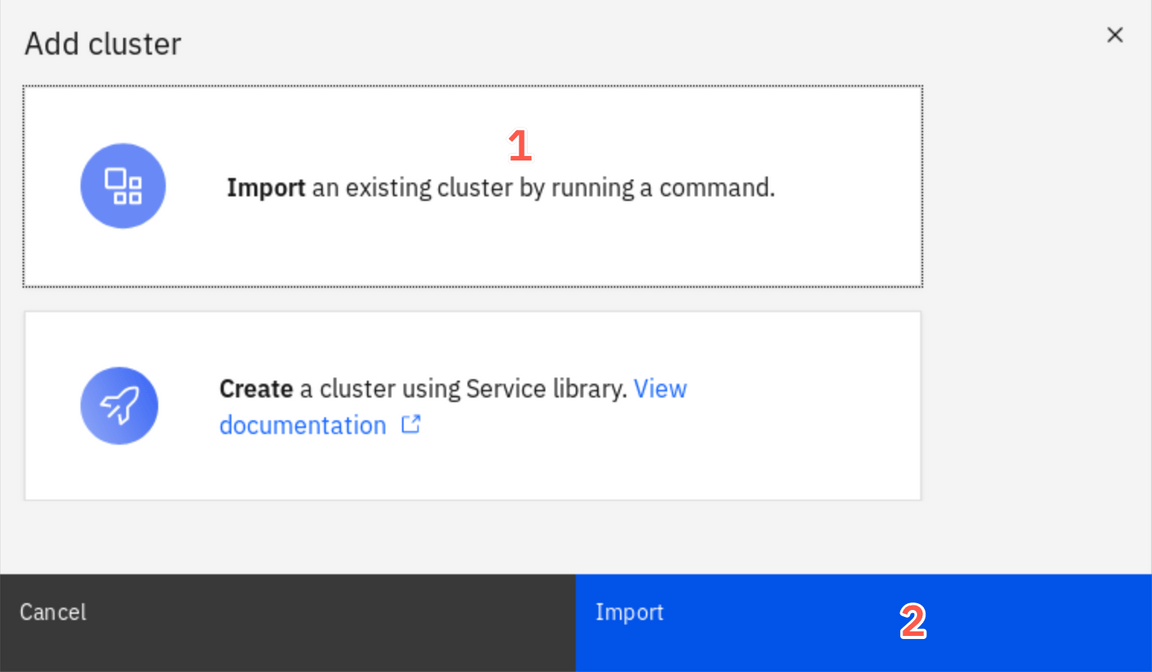
You can add a cluster by Importing an existing cluster or provisioning a new cluster using a Service Library. We use the first option. Select Import an Existing cluster (1) and click Import (2).
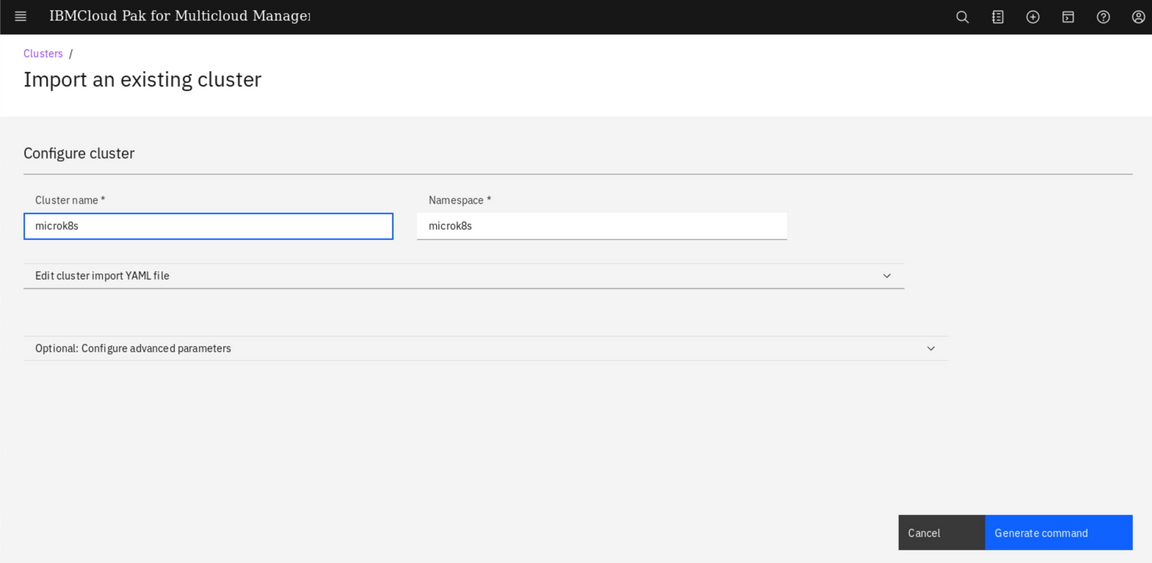
Enter microk8s for cluster name (1) and microk8s for namespace (2). Click Generate command to continue (3).
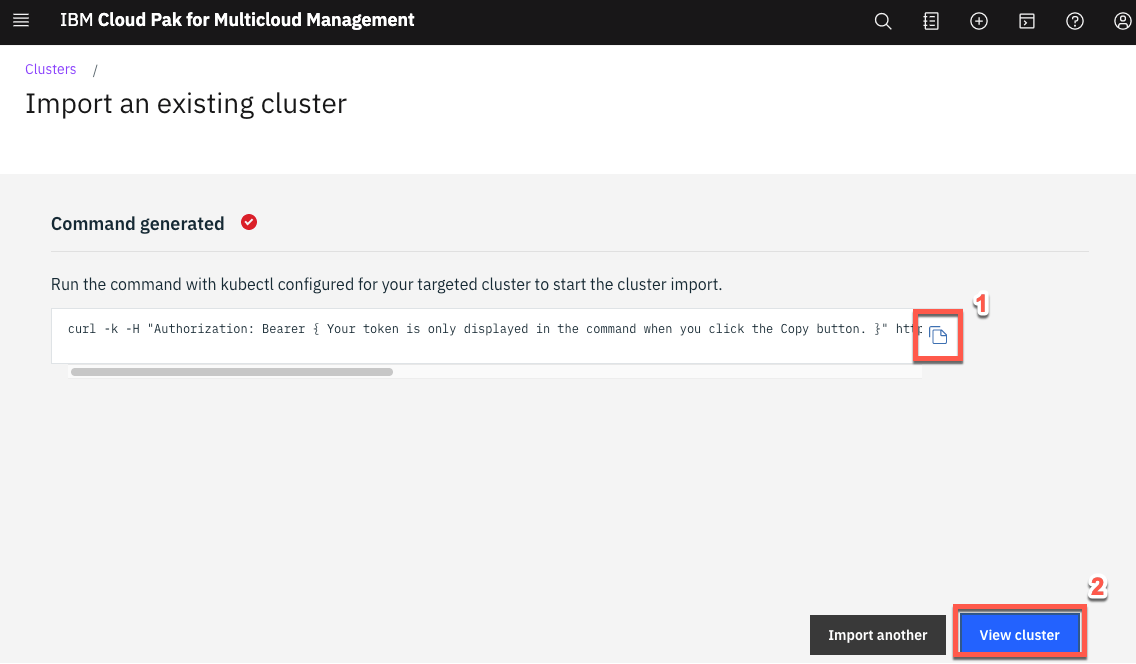
A curl command is generated that you will use to add the new cluster. Click Copy command button (1) and click View cluster (2) to see the new managed cluster details page.
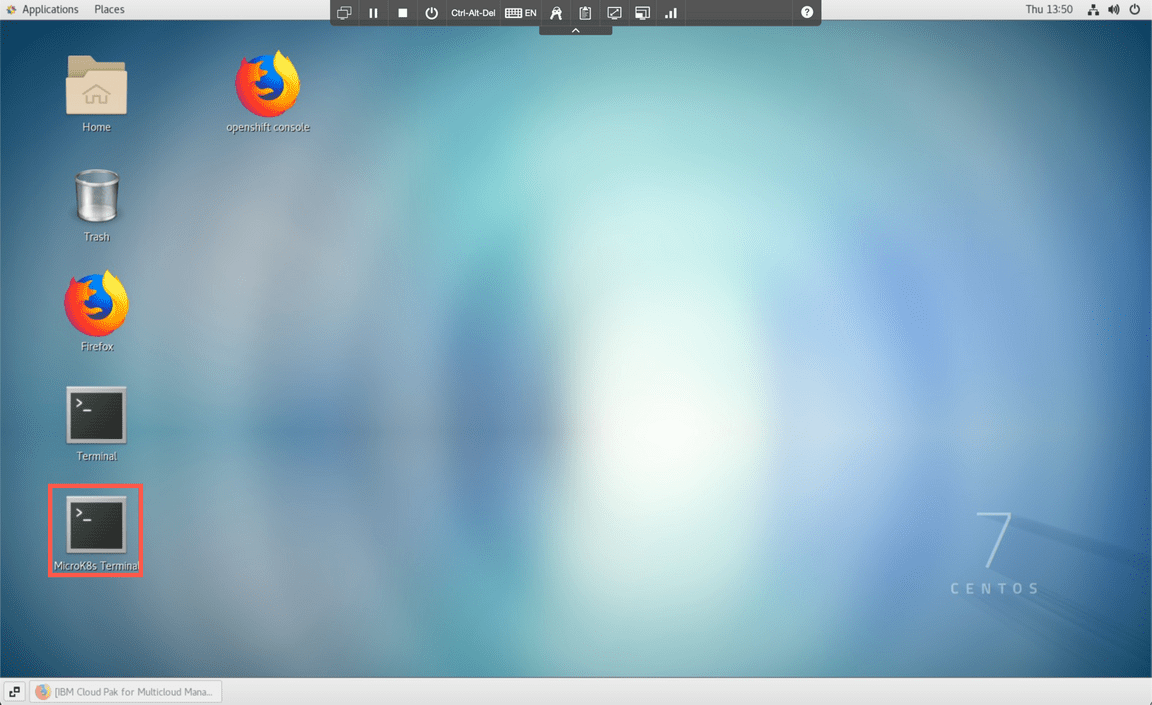
Go back to the desktop and open the terminal window to MicroK8s cluster clicking the MicroK8s Terminal link.
MicroK8s terminal has a yellow background. To verify the cluster status run the following command in the MicroK8s window
kubectl get nodes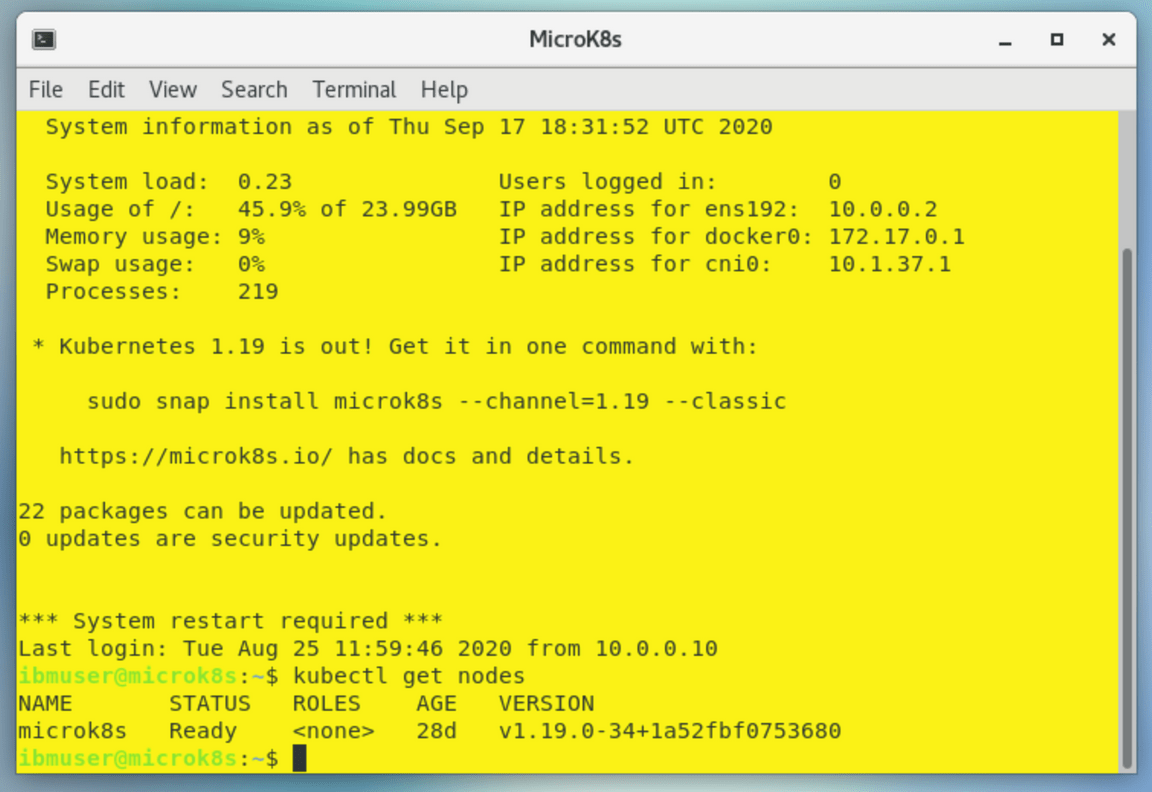
Great, you are accessing the managed cluster. Now you are ready to execute the generated command.
Paste the generated command that you previously copied in the clipboard. When you run the command, several Kubernetes objects are created in the multicluster-endpoint namespace.
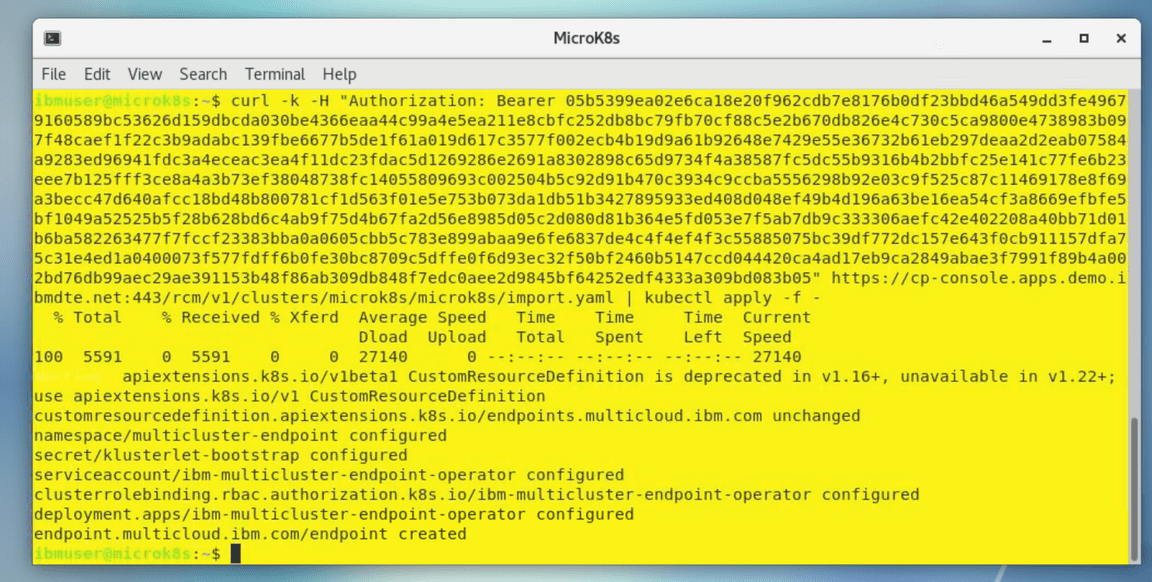
If you see the error as before - just run the command again.
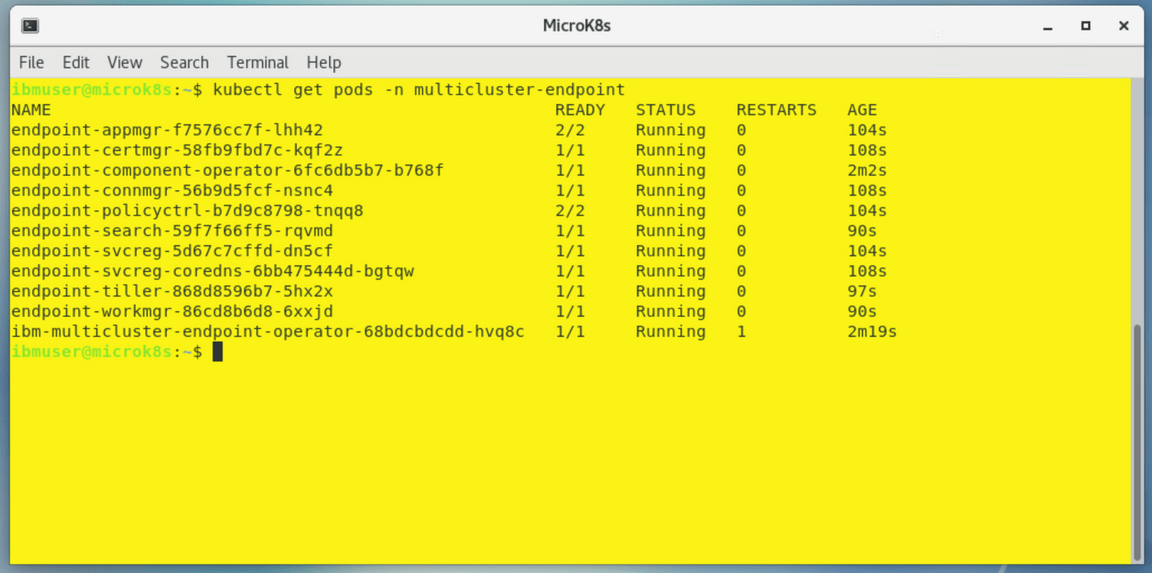
You can view the progress by entering the command:
kubectl get pods -n multicluster-endpointMake sure all the pods are in the running state.
Back to the browser window, click View cluster and make sure that the cluster status is Ready now (if necessary, refresh the details page).
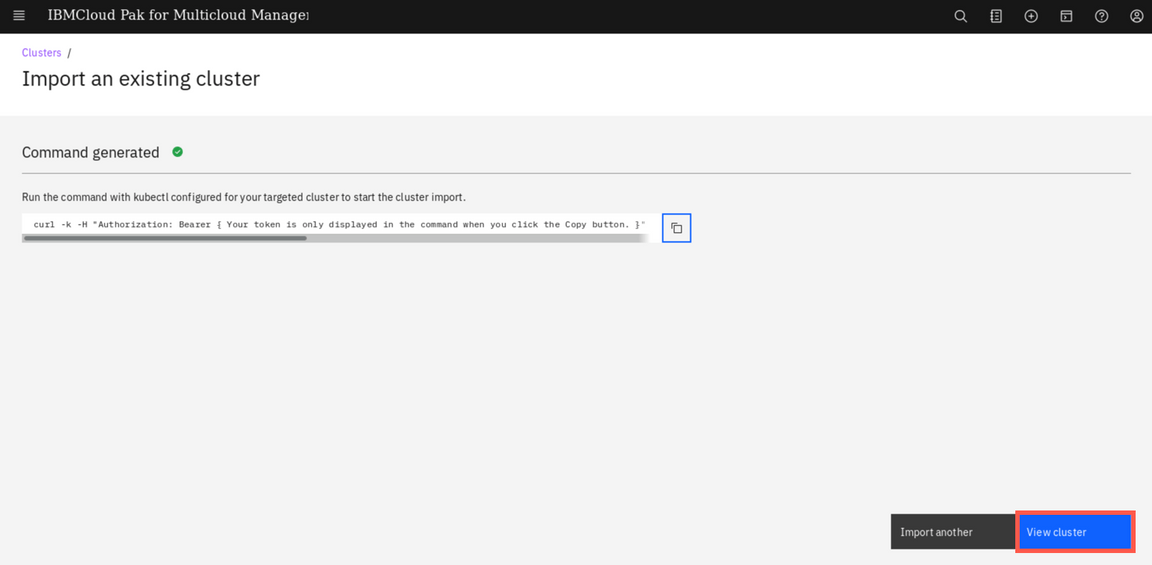
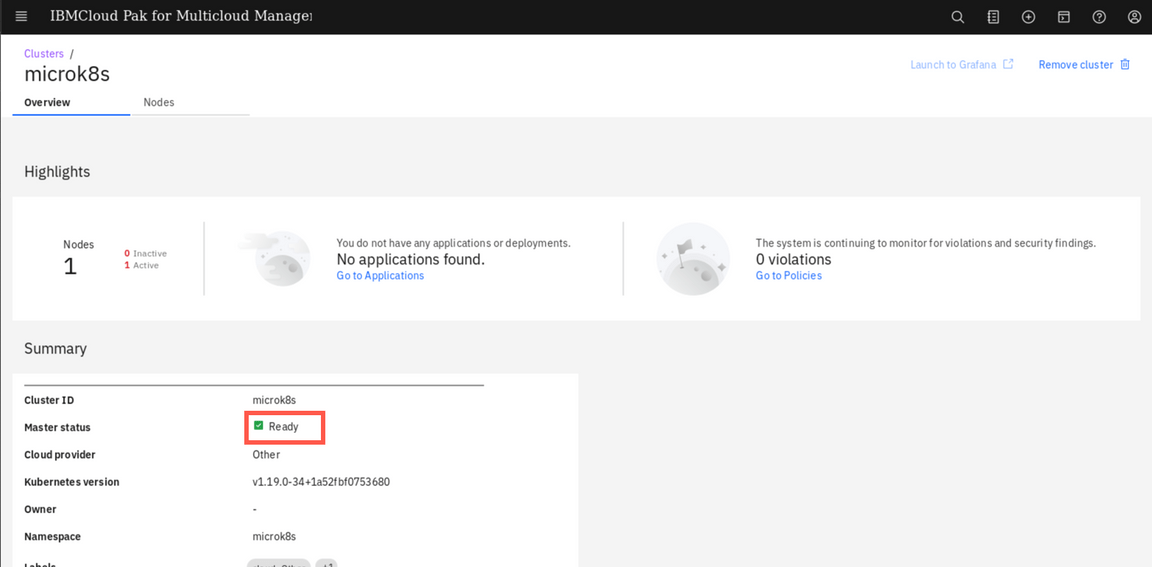
On the page navigation breadcrumb, click on Clusters link

Now you can see your managed cluster in a clusters list. You need to add labels to identify your new cluster. Labels are then used by the PlacementRules and PlacementPolicies to select clusters where different applications and policies should be deployed.
In the Cluster Management lab you could learn how to add labels using a web console. Below you will use alternative methods of modifying labels using a CLI.
First, you need to install a multicluster plugin to the
cloudctlcommand. Open the green terminal to the Management Hub and run the following commandscurl -kLo cloudctl-mc-plugin https://cp-console.apps.demo.ibmdte.net/rcm/plugins/mc-linux-amd64cloudctl login -a https://cp-console.apps.demo.ibmdte.net -u bob -p Passw0rd -n defaultcloudctl plugin install -f cloudctl-mc-pluginNow, you can manage your remote clusters with the cli. To list the labels for microk8s cluster, in a green Management Hub terminal run:
cloudctl mc describe cluster microk8s -n microk8s -c hub0To add a new label environment=QA run the following command in a green Management Hub terminal
cloudctl mc label cluster microk8s environment=QA -n microk8sThe remote Kubernetes cluster is now registered as a managed cluster. In the next step, you will deploy the cloud native monitoring to that mamnaged cluster.
Deploy cloud native monitoring
When the Cloud Pak for Multicloud Management is installed with the Monitoring module, you can automatically deploy the Kubernetes data collector to the remote managed clusters. This data collector is capable of gathering and sending to the Management Hub information about performance of all nodes, pods and other resources running in a managed cluster.
To deploy Kuberenetes data collector (also known as cloud native monitoring) complete the steps below.
First, you need to label target cluster with ibm.com/cloud-native-monitoring=enabled. You can do this in web console, or run the following command in a green terminal titled Management Hub
cloudctl mc label cluster microk8s ibm.com/cloud-native-monitoring=enabled -n microk8s
Second, you need to add the target cluster namespace as a managed resource to your team. Again, you can do this in web console (Menu -> Administer -> Identity and access -> Teams tab, select the team ‘operations’, edit the Resources), or run the following command in a green terminal titled Management Hub
cloudctl iam resource-add operations -r crn:v1:icp:private:k8:mycluster:n/microk8s:::This command adds a namespace microk8s (this namespace was automatically created during cluster import and contains the cluster CRD) as a managed resource to the team operations. This operations triggers the deployment process of cloud-native-monitoring operator to the target cluster.
You can check that the operator was deployed running the following commands in a yellow terminal connected to MicroK8s cluster
kubectl get pods -n cp4mcm-cloud-native-monitoring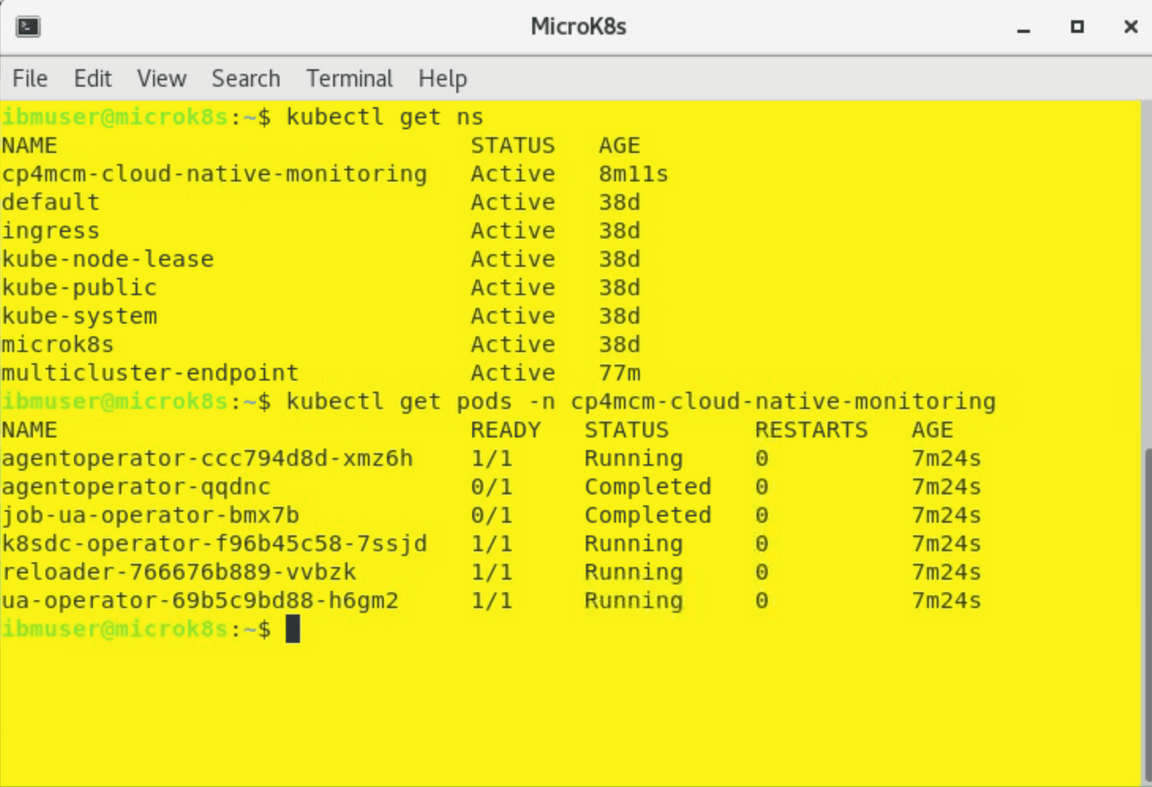
Finally, you need to open the Monitoring module console as a user belonging to the operations team - user bob in our case. Select “hamburger” menu in the top-left corner and then Monitor health (2) and Infrastructure monitoring.
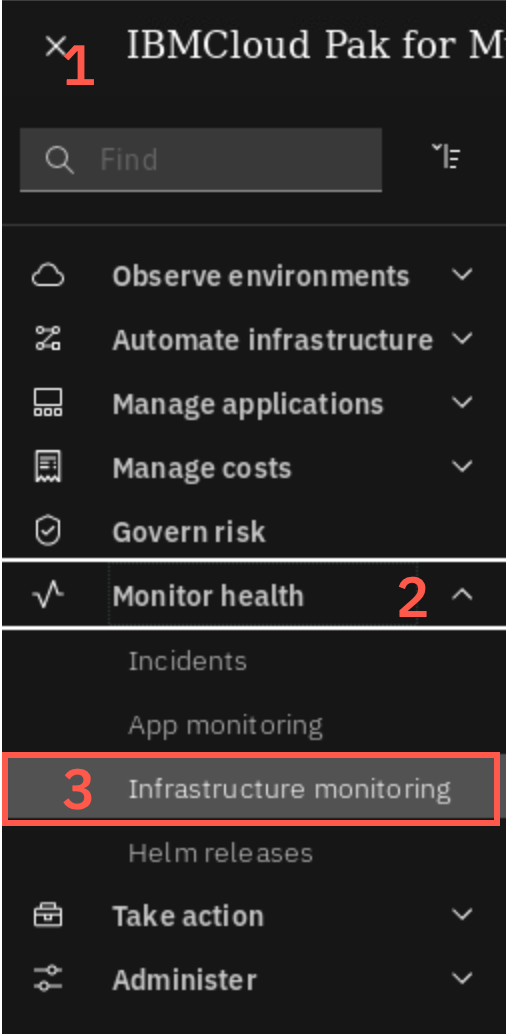
If you are redirected to login page, login again as user bob with password Passw0rd. Eventually, you should see the Resources tab shown below:
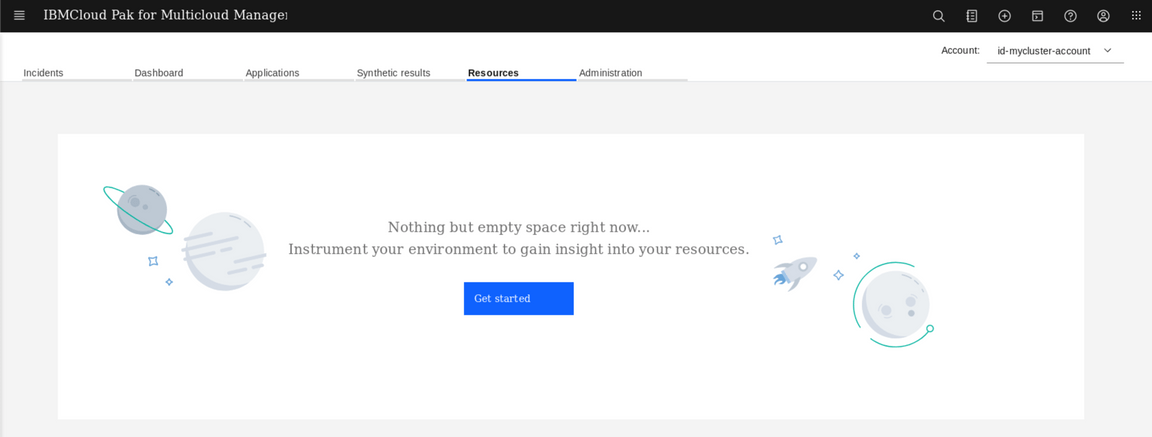
The page probably won’t show any resources yet, because the process to install Kubernetes data collector was just started. You can check if it was successfully deployed running the previous command again (in yellow terminal).
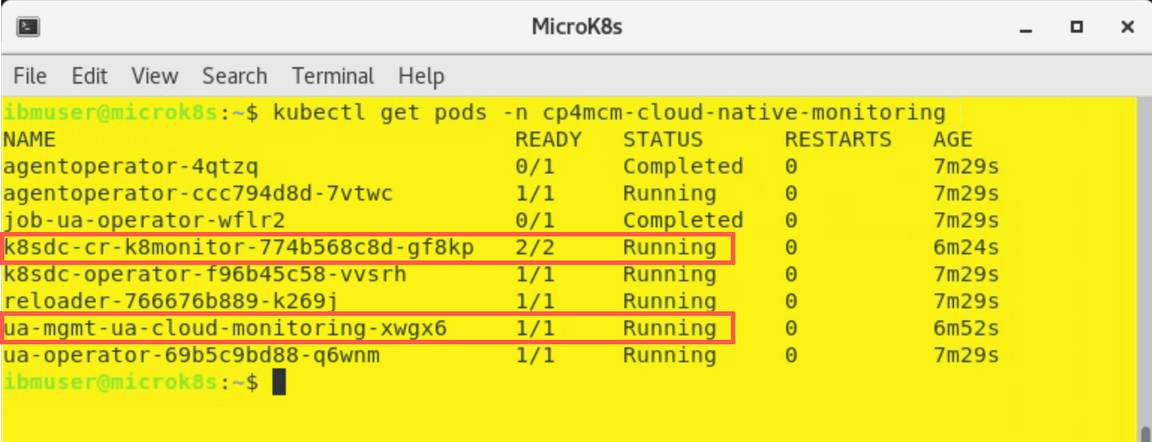
When it is deployed, after 1-2 minutes you can refresh the browser, and you should see the view showing now all the resources from the managed cluster.
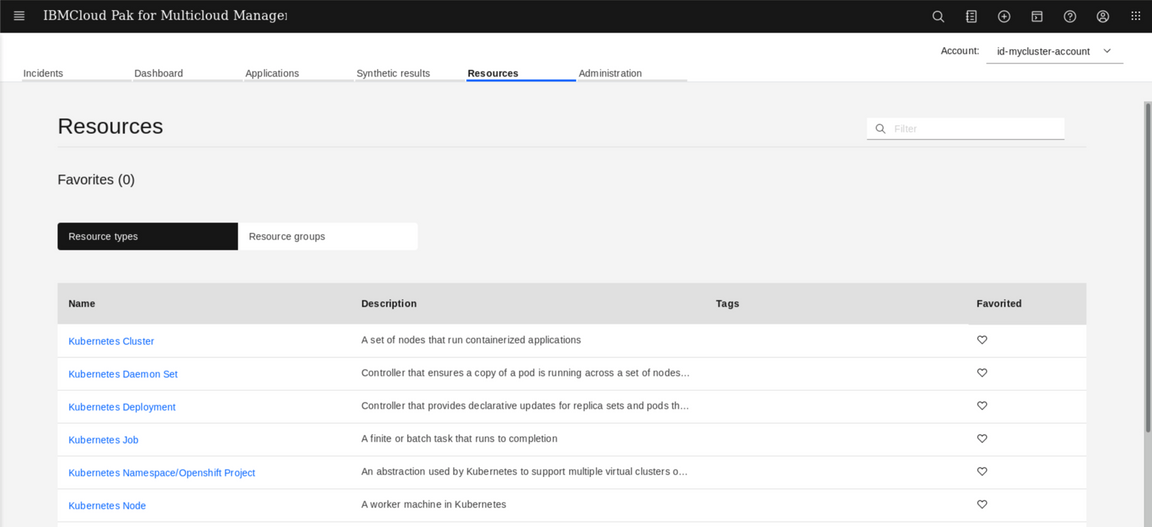
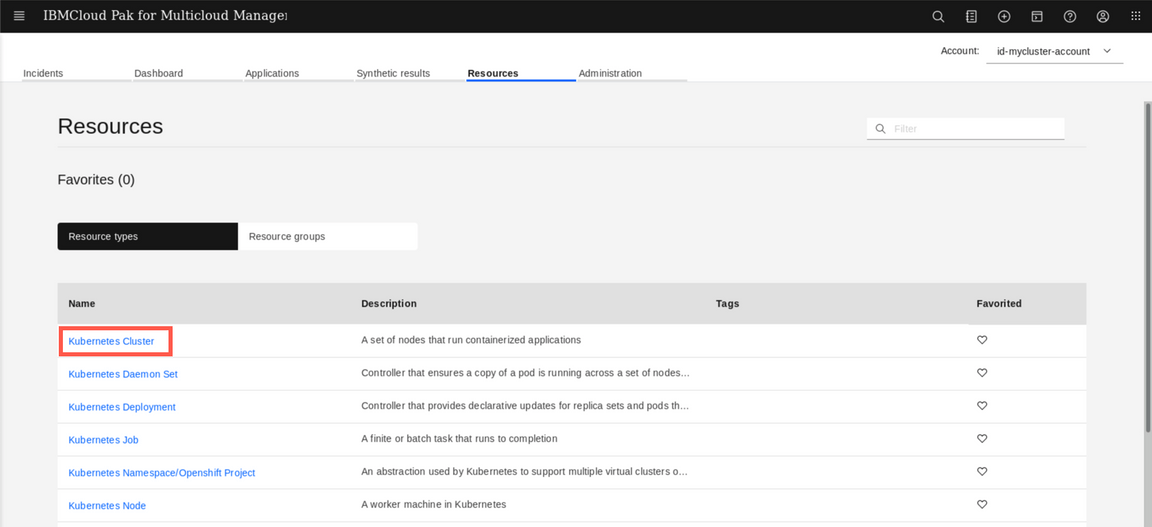
Click the Kubernetes cluster.
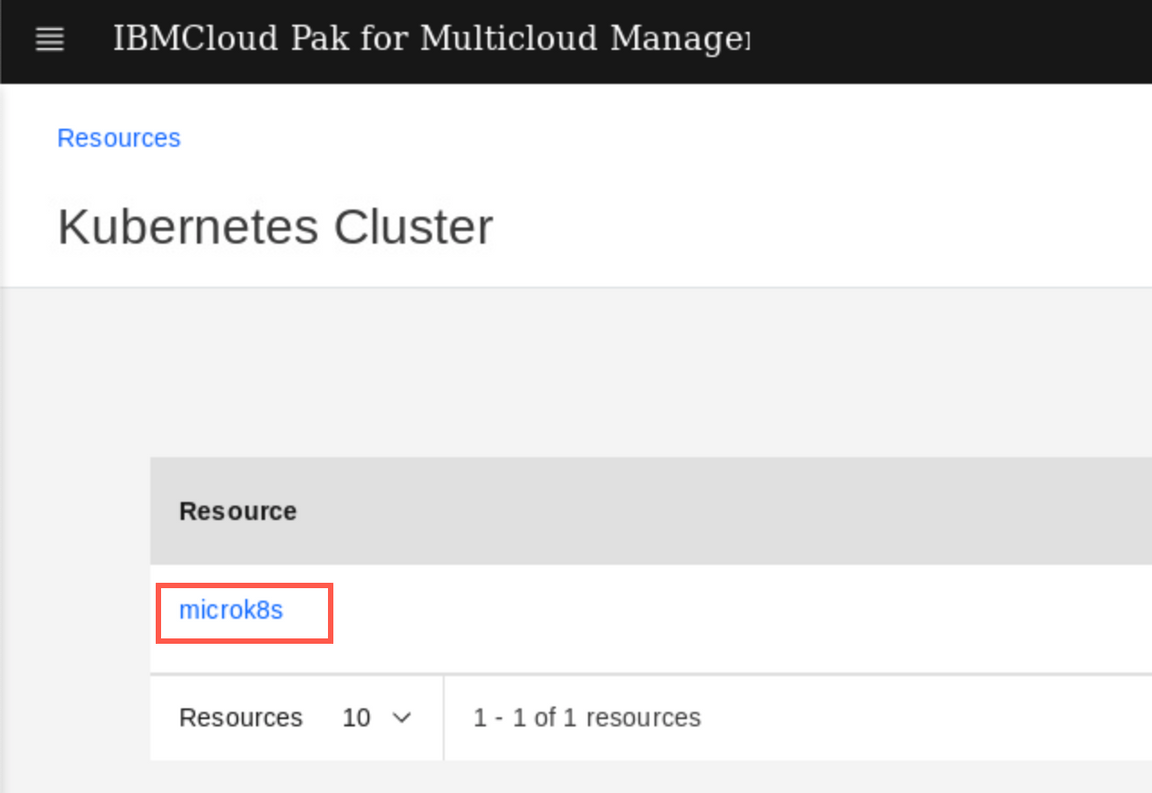
Then click microk8s.
The next view, let you explore the metrics and events releated to the selected resource. On top, you can see the Event timeline (1) for wihich you can change the time window (from 30 minutes to 1 week). Deployment topology widget (2) shows how the specific resource is located within the cluster.
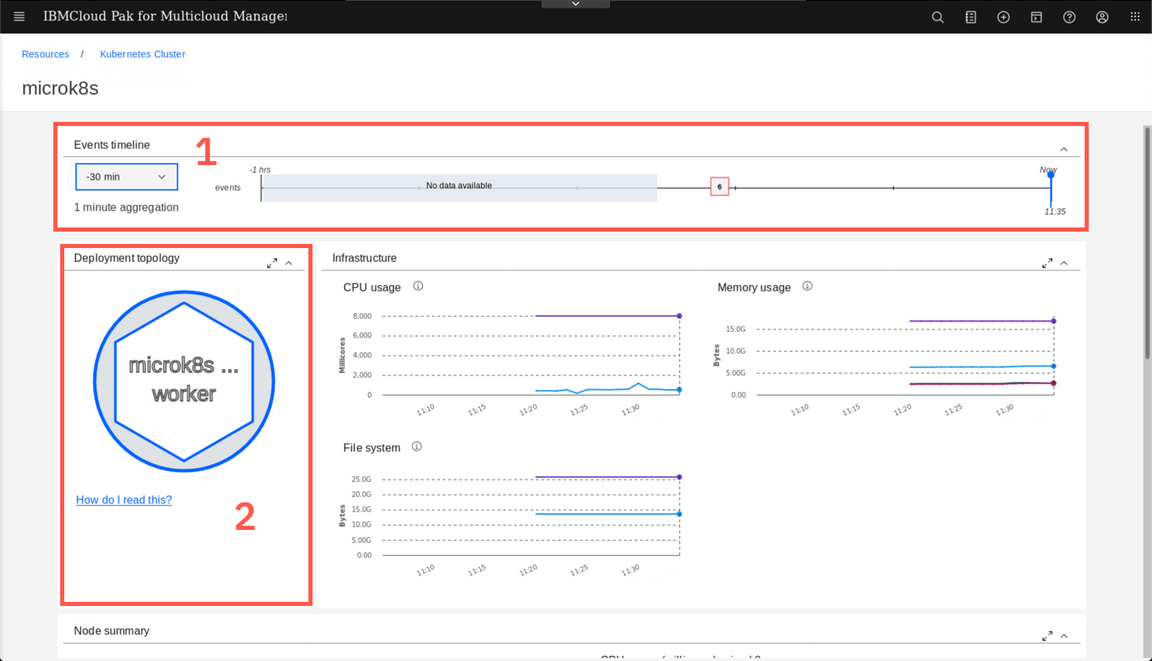
If you hover over the numbers on the Timeline (1) you can see the details of the events. You can also click the ‘How do I read this’ link (2) on the Deployment topology to learn hot to use that widget.
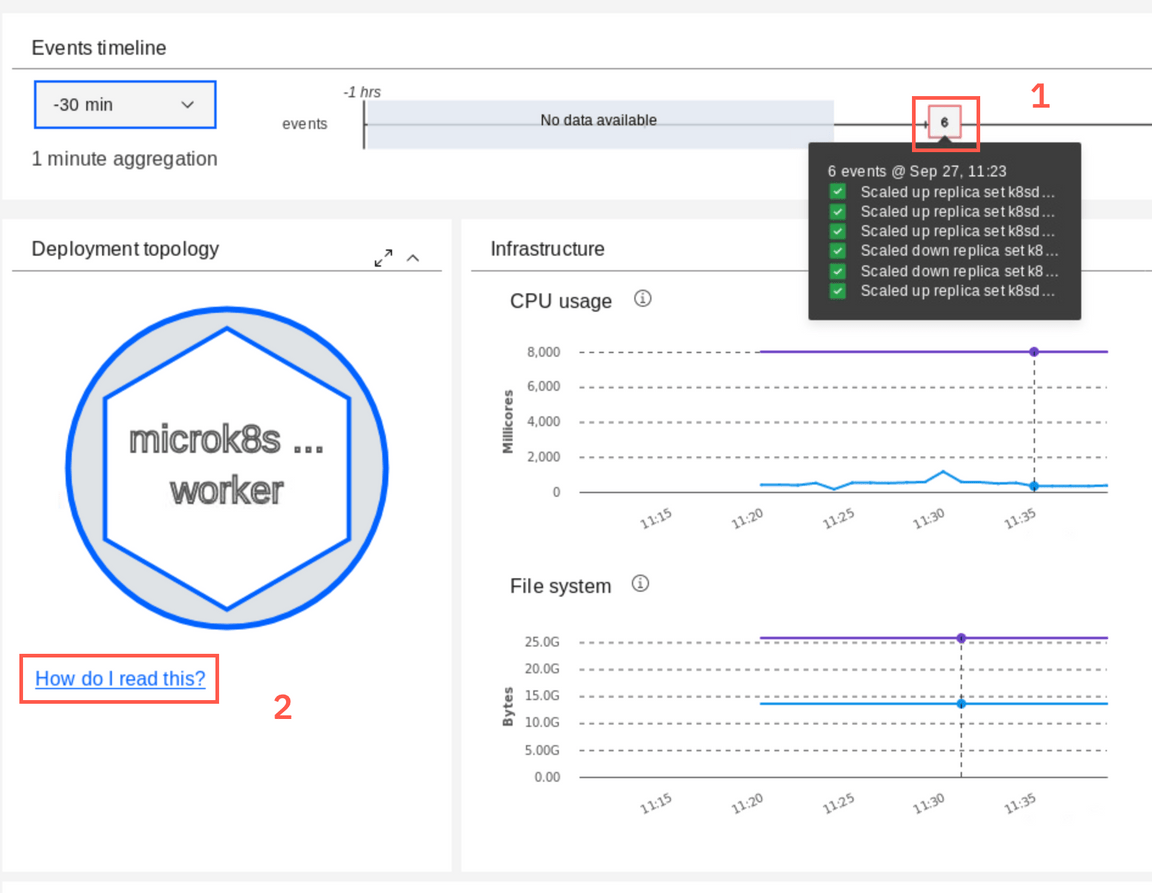
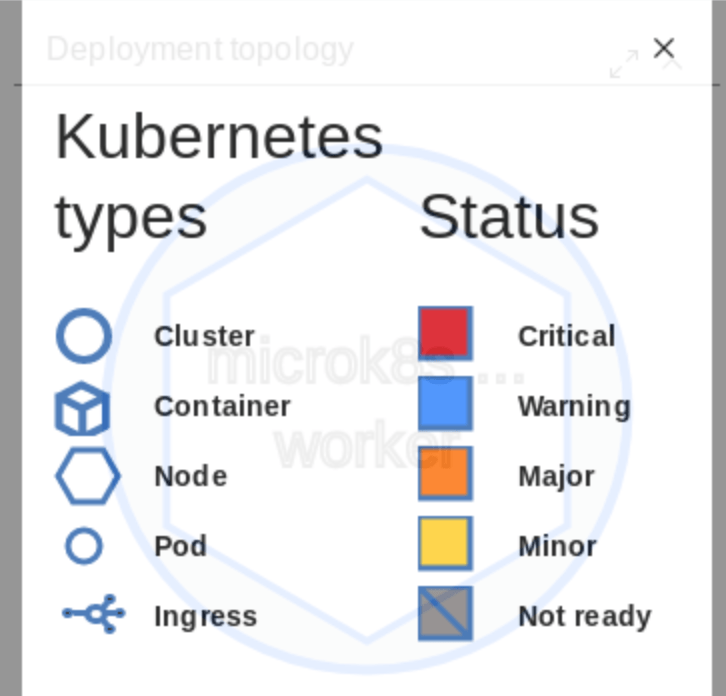
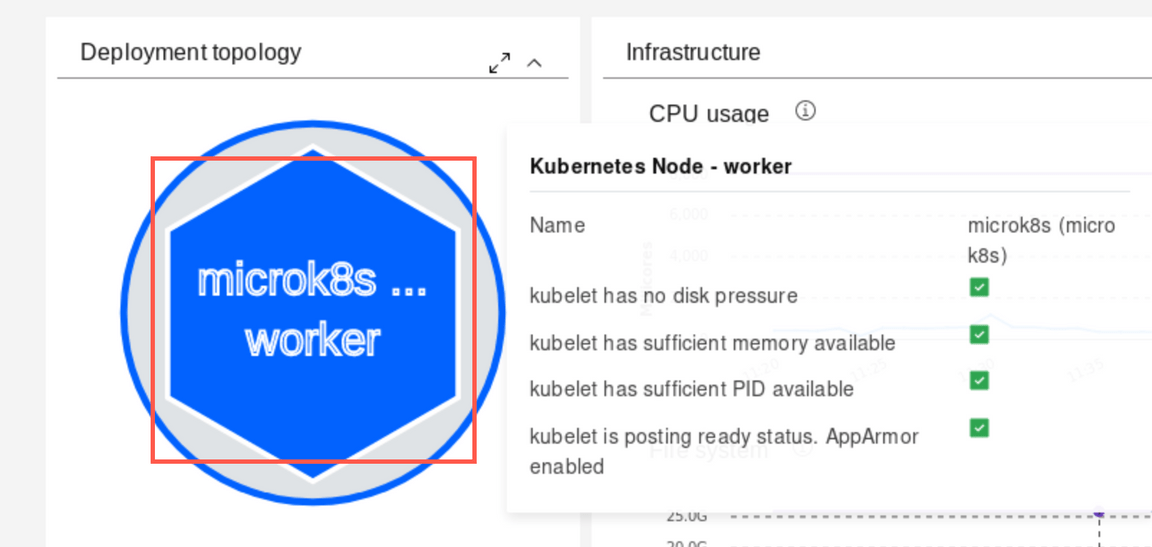
Feel free to explore other resources and their metrics. For example you can click the worker node icon on the Deployment topology widget.
Deploy Bookinfo Application
On top of monitoring Linux worker nodes and basic Kubernetes objects Operations teams want are responsible for monitoring business applications. So let’s deploy sample application, called Bookinfo
To start, clone the git repository containing the yaml files needed to deploy the application. Using the green terminal window, run the following commands on the Management Hub
git clone https://github.com/dymaczew/chartscd chartsApply the application resources running the following commands:
/home/ibmuser/oclogin.shoc apply -f bookinfo-multiclister-2020.2.1oc apply -f kubernetes-1.18-ingress-deployable.yamlIf you happen to run Kubernetes 1.19 on the your managed cluster (outside the Skytap environment) use kubernetes-1.19-ingress-deployable.yaml. Ingress API was changed in 1.19 and extended with new mandatory fields
The output looks like the following:
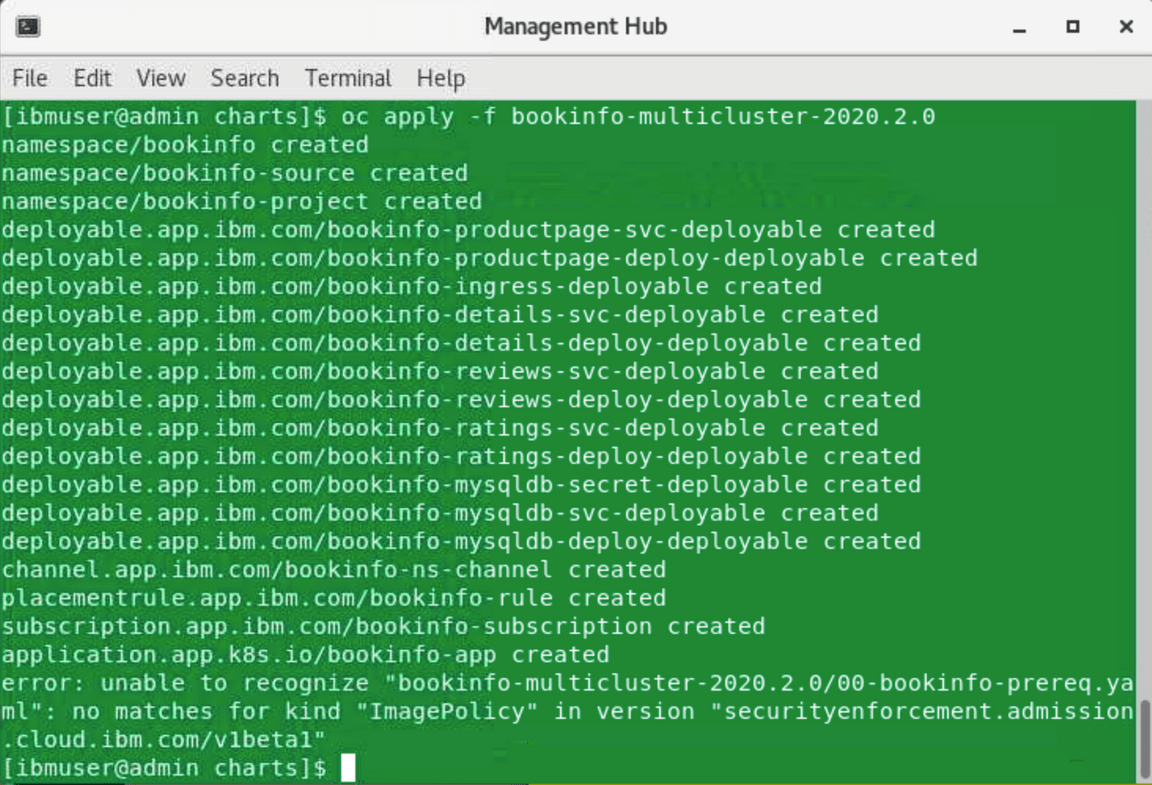
Don’t worry about the error in the last line - it just means that ImagePolicy admission controller is not used in the environment.
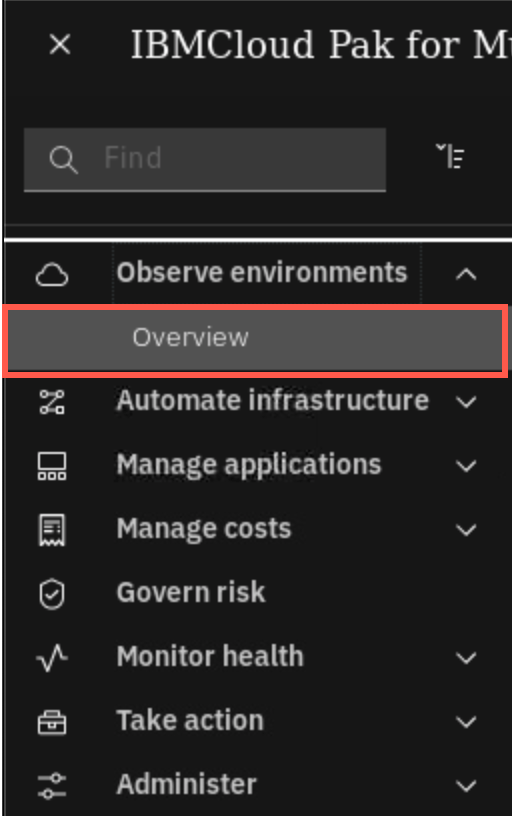
Now, let’s edit the placement rule for the application to get it deployed on the managed cluster (we tagged in with label “environment=QA”). Navigate to application view, selecting the “hamburger” menu in the top-left corner, then Observe environments and Overview
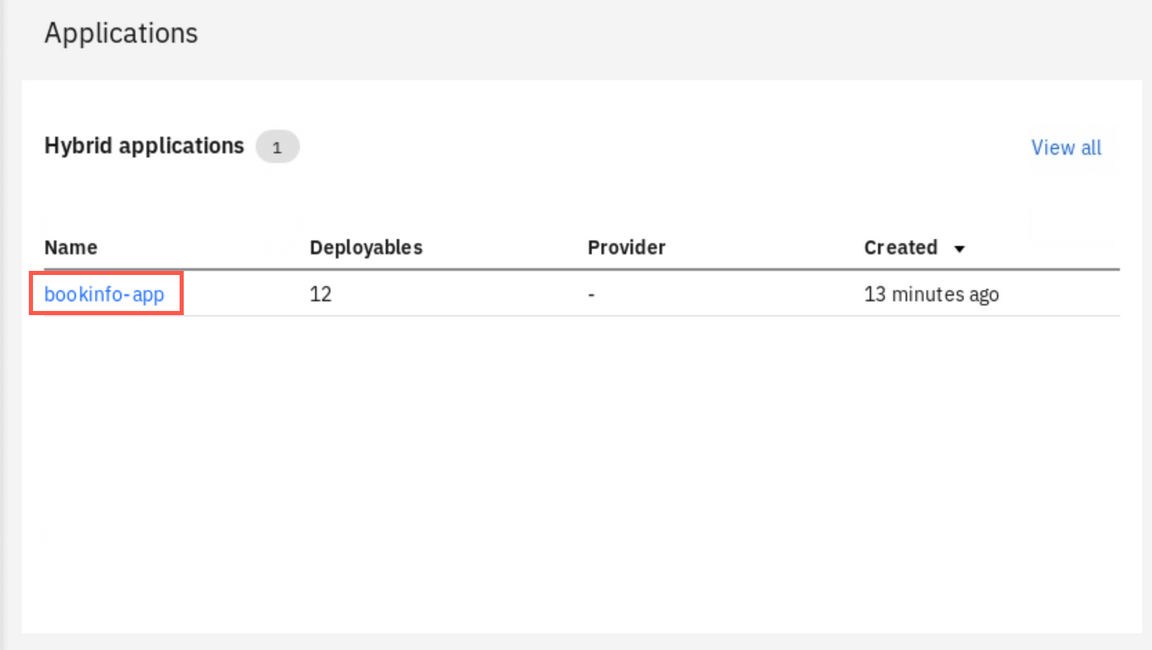
On the overview page, scroll down to the Applications section and select bookinfo-app link. We recommend this way, becasue for some reason (probably a bug?) the application is not listed directly on the Hybrid Applications list
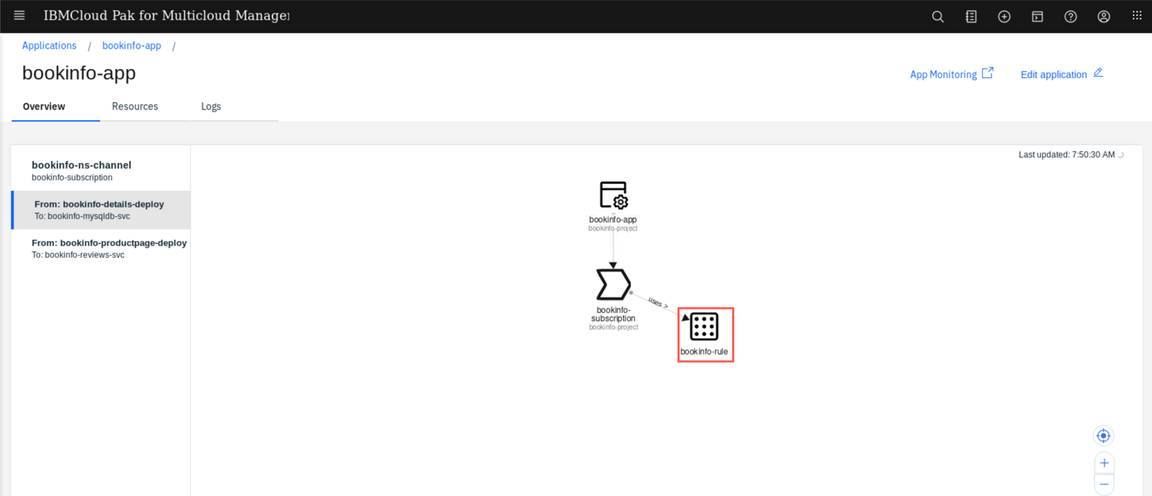
When the Application view opens, click on the bookinfo-rule icon
Edit the placement rule in the editor on the right, changing the value of the label from Dev to QA (1) and then apply you changes with the button on top of the editor(2)
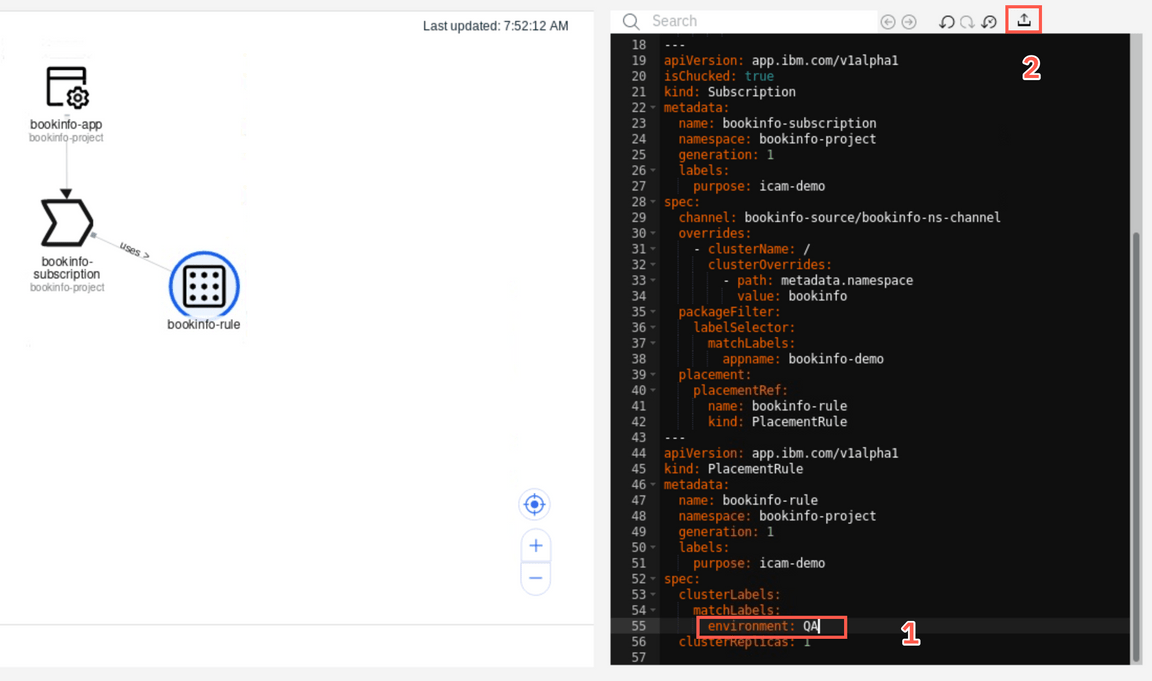
After a few seconds, you should notice that the application is now being placed on the microk8s cluster. The deployment takes usually 1-2 minutes needed to pull images and start containers.
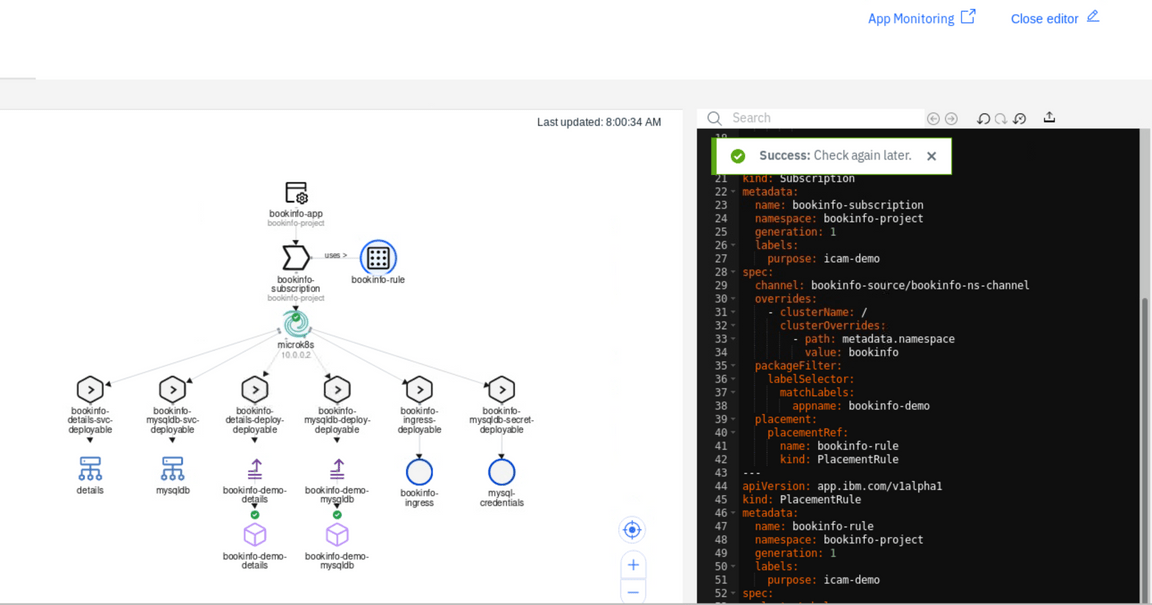
You can verify if the application was successfuly deployed and is accessible by opening a new browser tab and entering the URL:
bookinfo.10.0.0.2.nip.io. You should reach the page that looks like below: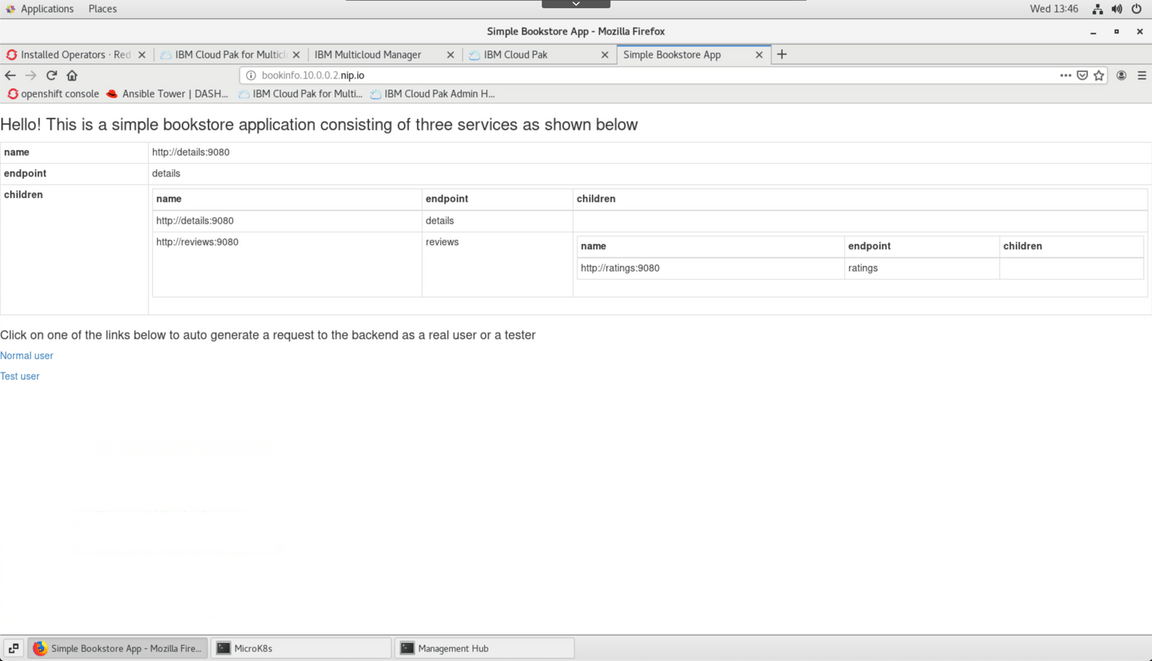
Exploring synthetics monitoring
Cloud Pak for Multicloud Management is capable of monitoring the application availability using a synthetic transaction monitoring. There is a default agent installed on the Hub cluster that automatically starts monitoring any ingress object that is deployed as a part of Hybrid application. Let’s check how it looks like.
Open the Monitoring module interface (Select “hamburger” menu, then Monitor Health, then Infrastructure monitoring). Then select the Synthetic results tab

On the page Synthetic results page, you should see the automatically configured monitor for ingress deployed as a part of Bookinfo application. Click on the monitor name to explore details

You can adjust the scope of the timeline, reducing the windows to last 30 minutes (1). You can also select to see a Response time graph or a response time Breakdown (2). This helps to diagnose issues related to name resolution on establishing the SSL session.
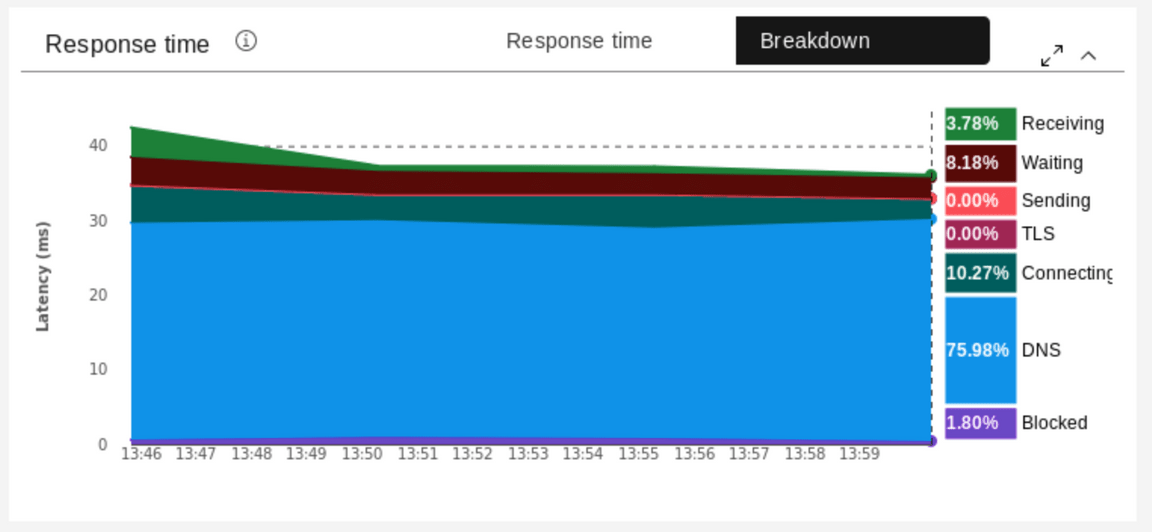
When you scroll down you can see the results of actual tests. Select any dot on the graph to see detailed breakdown of the response.
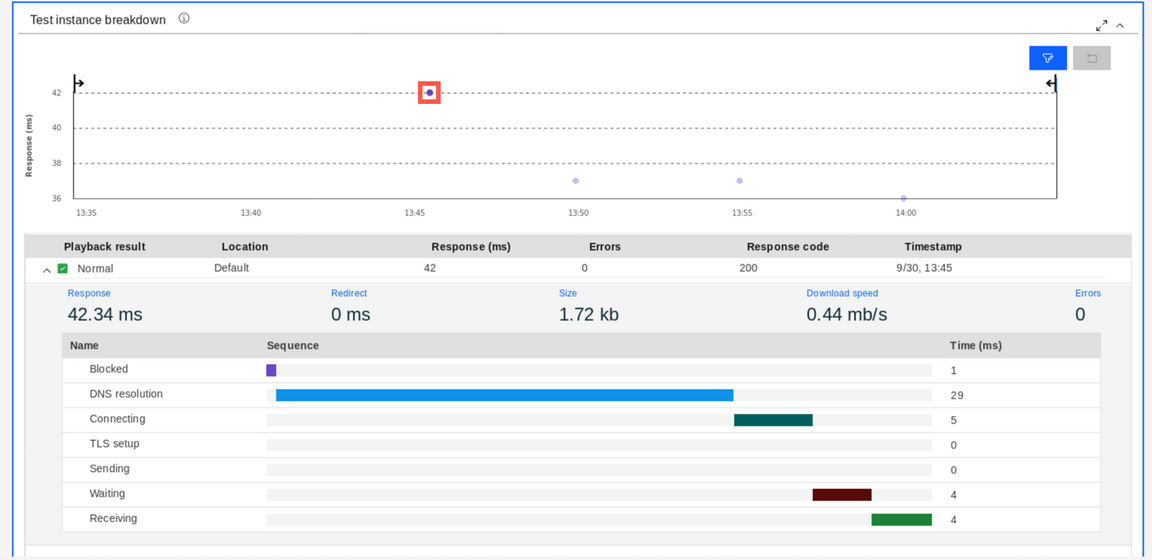
You can deploy more agents in different locations to have your applications tested for availability and response time from a customer perspective. Deploying own agents allows also to configure more sophisticated test schedules. Let’s see how it works.
Go to the green terminal titled Management hub and run the following commands to unpack the synthetics agent binaries that were downloaded for you.
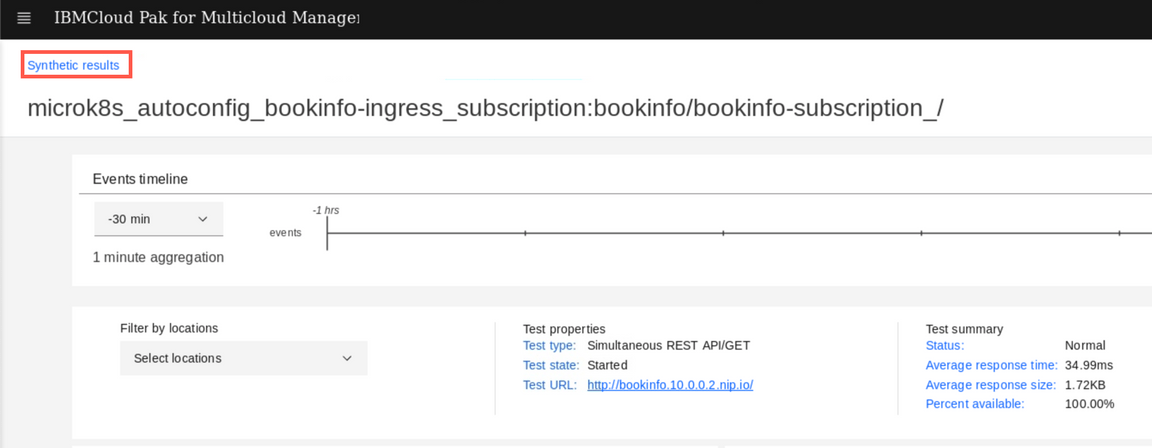
cdtar xvf app_mgmt_syntheticpop_xlinux.tar.gzcd app_mgmt_syntheticpop_xlinuxTo configure the synthetic monitoring agent you need a config pack that will instruct agent where to look for test definitions and where to send the gathered data. Go back to you browser, click the Synthetic results breadcrumb in the top-left corner of the screen. Then select the Administration tab.

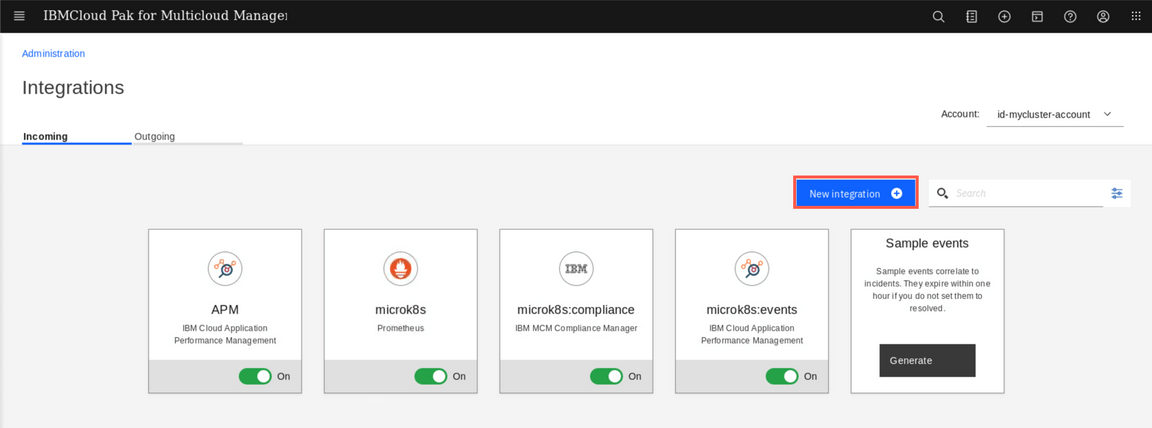
On the Administration view select the Integrations tile, then New integration button.
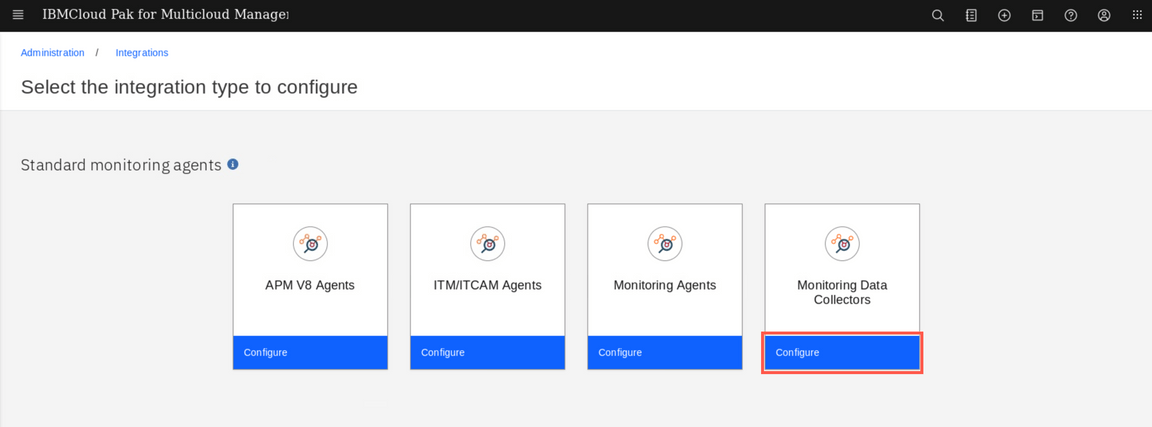
Click Configure under the Monitoring Data Collectors tile
Do not provide any name, just click the Download file button and save the file to your workstation
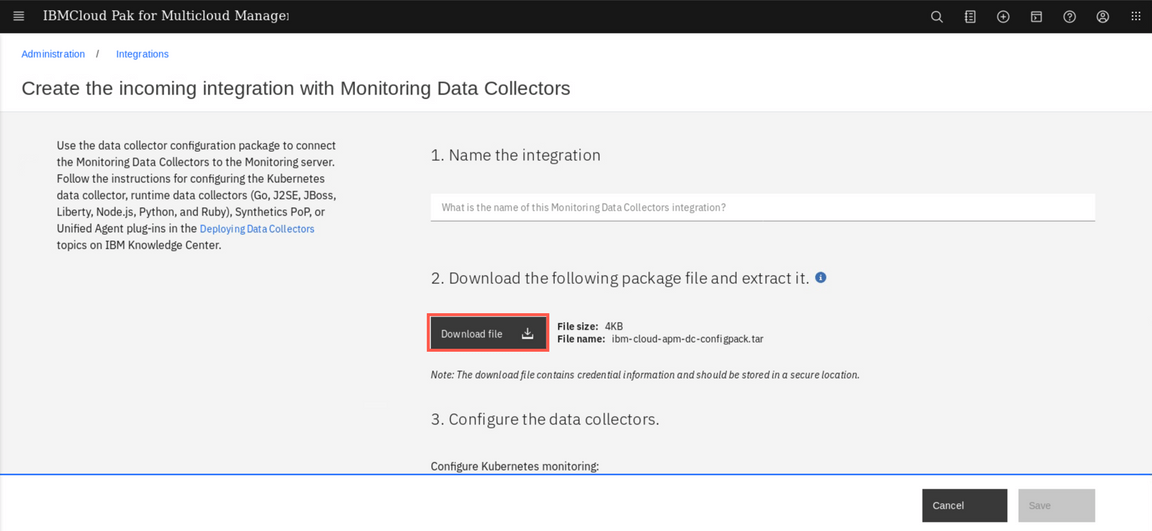
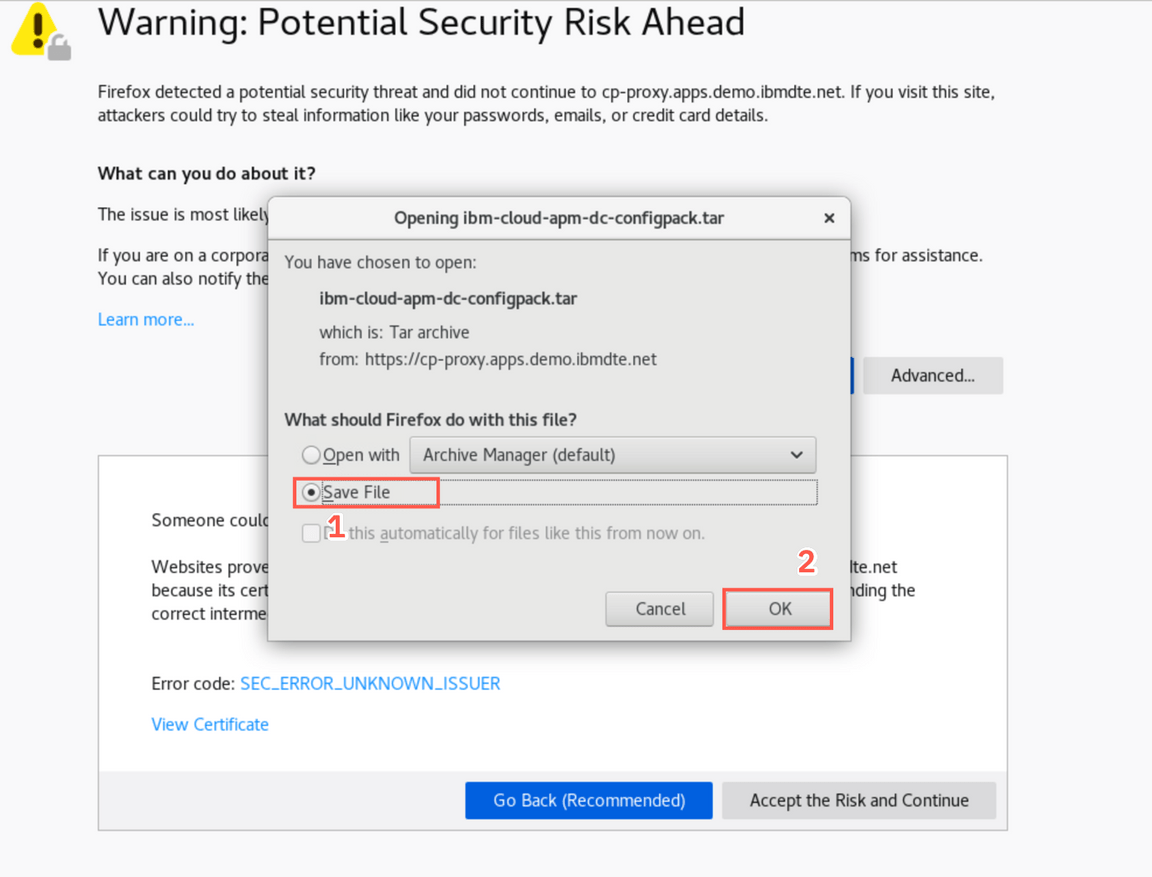
Go back to the green terminal titled Management Hub and run the following commands to preconfigure and install the Synthetic Monitoring agent
./config-pop.sh -f /home/ibmuser/Downloads/ibm-cloud-apm-dc-configpack.tarAnswer the installation wizard with the following values:
You will configure a new local point of presence (PoP).Enter a name for your PoP. Your PoP will be identified by this name: pop_user1 -- A point of presence nameThe PoP name is set to pop_user1Enter the name of the country in which your PoP is located: USA -- Use any countryThe country name is set to USAEnter the name of the city in which your PoP is located: Las Vegas -- Use any cityFinally, run the following command to start the agent:
./start-pop.shNow, when you have additional Point-of-Presence (syntectic monitoring agent) installed, go back to your browser and navigate to the Administration page, and then select the Synthetics tile.
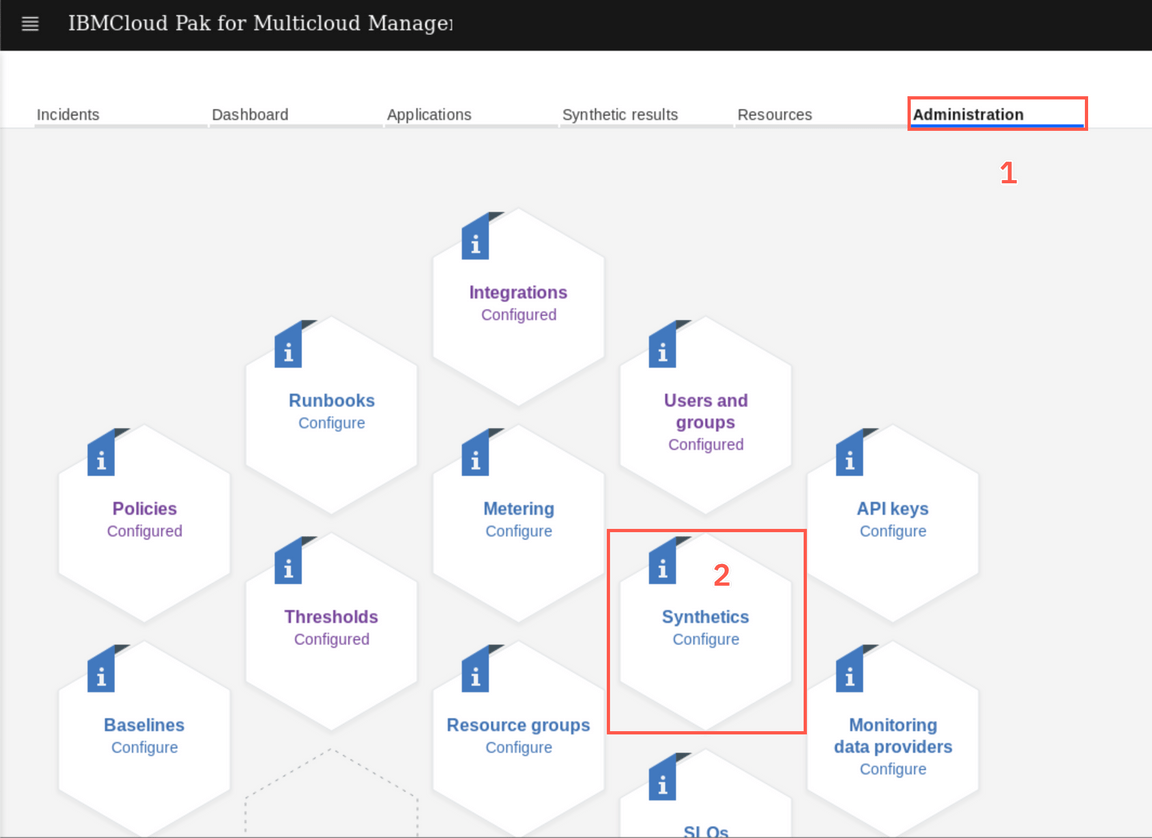
Click Create button

Give your test a name and description.

Scroll down and select the test type (Webpage). You can notice there are other types of tests available - you can for example replay web session recorded with Selenium, or create API tests using either SOAP or REST APIs.
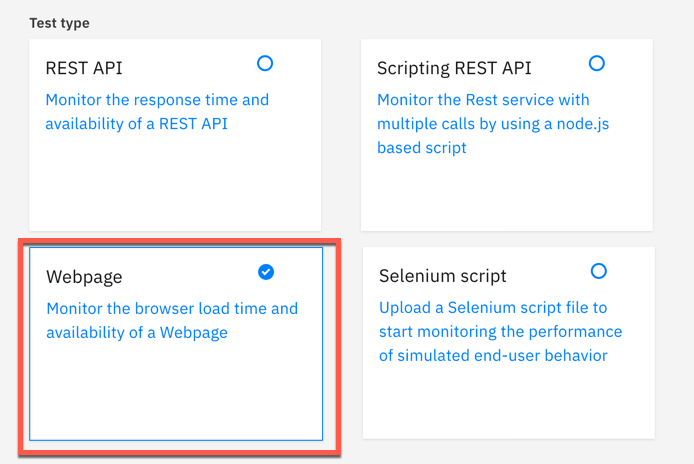
In the next step you need to provide the URL of the bookinfo main application page. Scroll down and provide the following values:
IMPORTANT Use the above URL, don’t worry that the screenshots below shows differnt one!
Threshold value for Warning: 1
Threshold value for Critical: 2
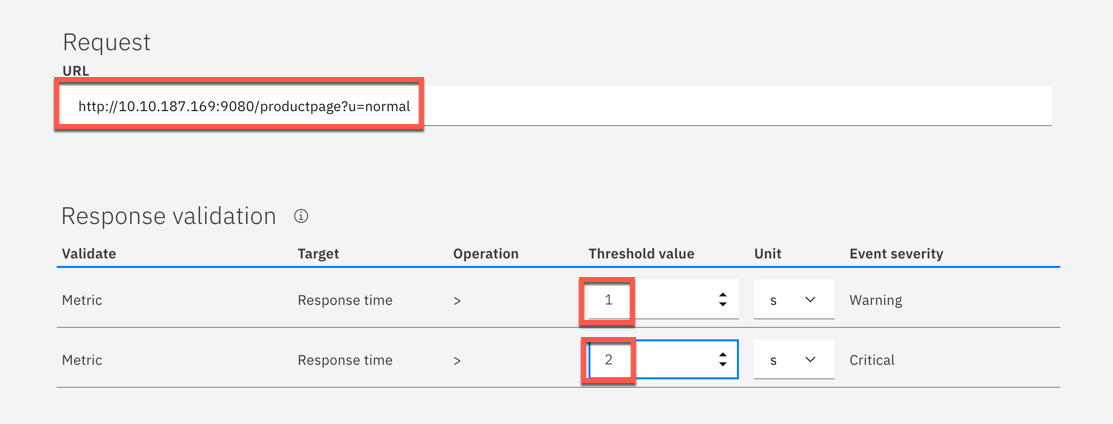
Click Verify test
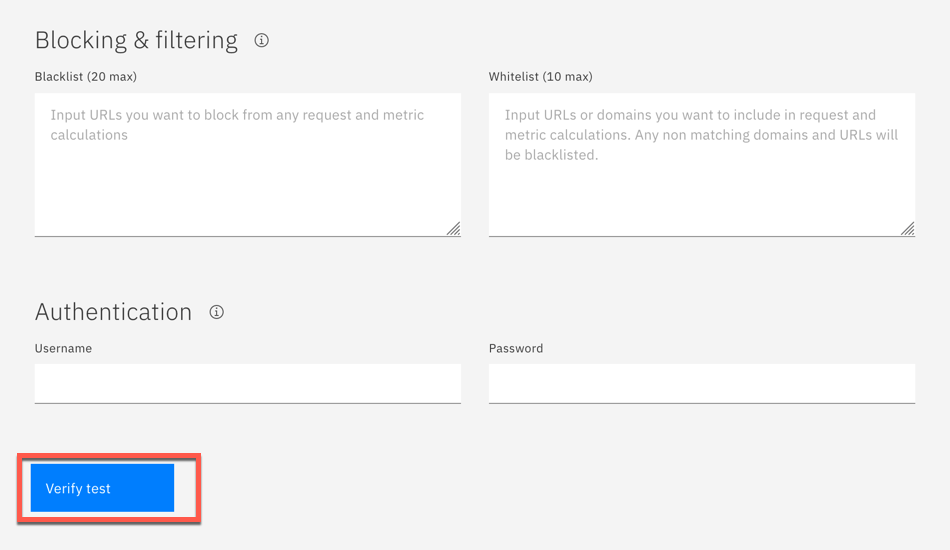
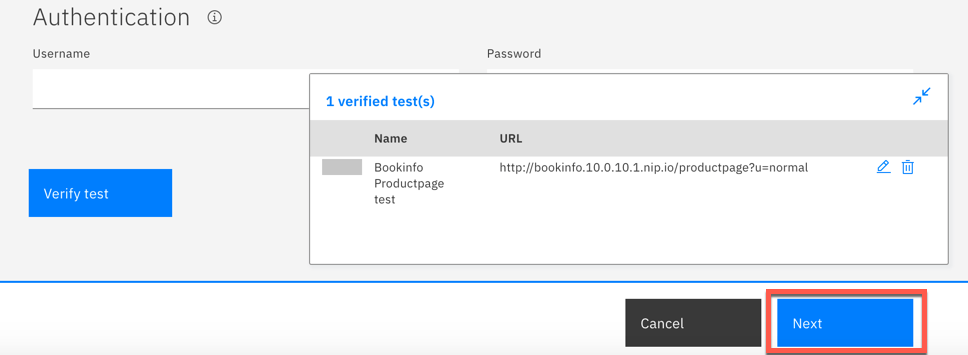
On the next page, change the test frequency to 1 minute and make sure that your previously installed PoP agent is selected
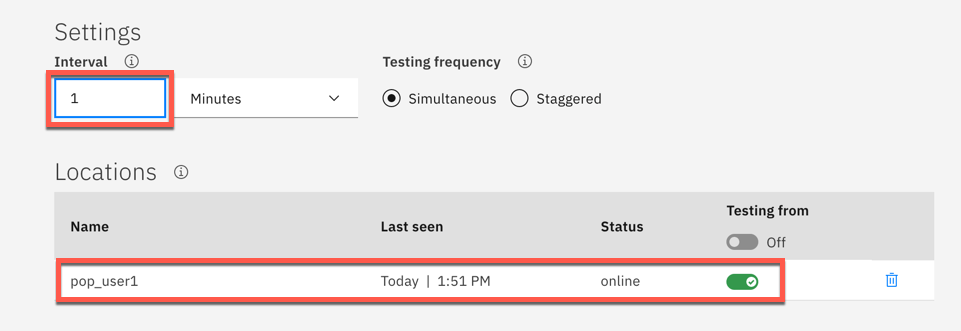
Click Finish at the bottom of the page
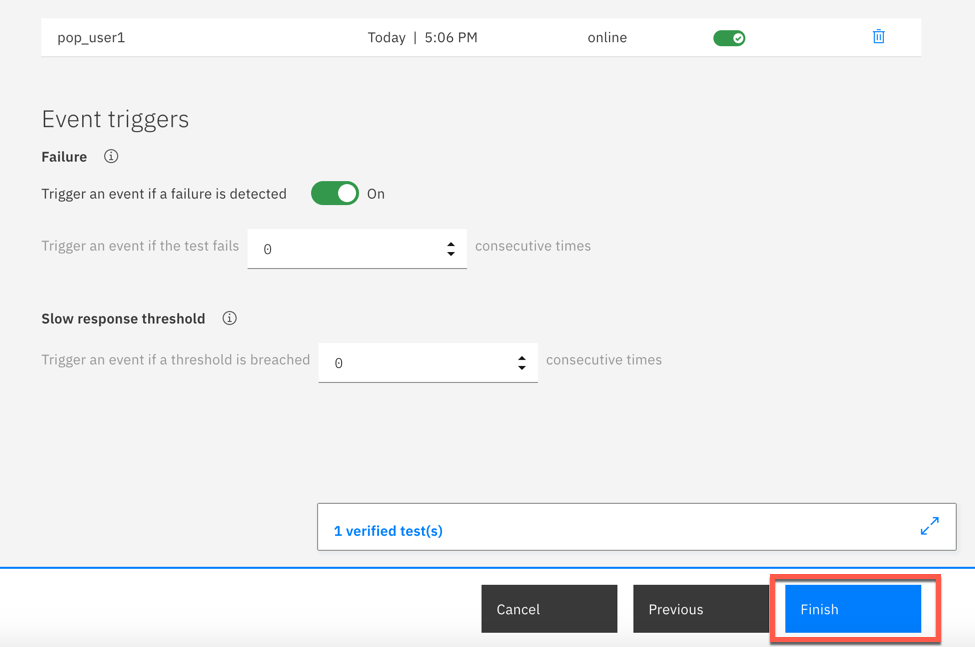
Now, you have synthetics agent that will generate the traffic against the Bookinfo application. You can move to the final part of the tutorial, exploring tools available for Site Reliability Engineers.
Explore SRE Golden Signals
During this lab exercise, you will be exploring the Golden Signals. The Golden Signals are a way of normalizing the performance KPIs to make it easier and more intuitive for an SRE to debug a problem.
In the browser with the Cloud Pak user interface, click the Resources tab
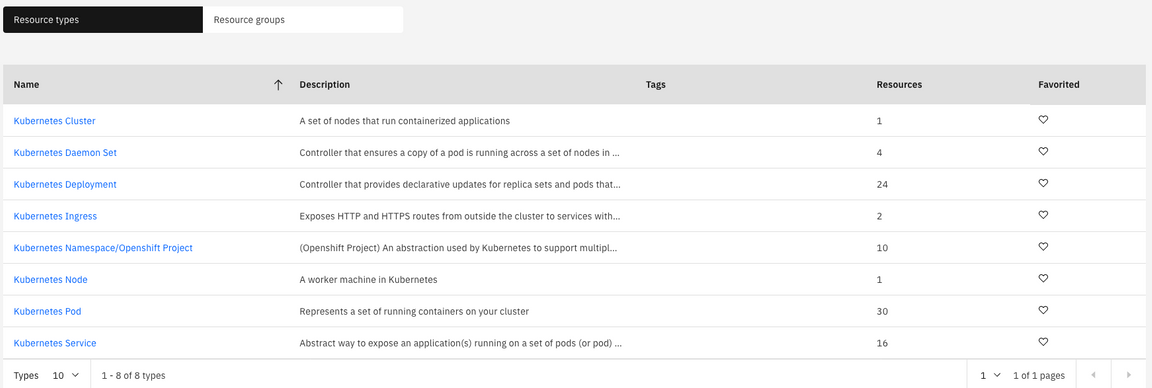
Select “Kubernetes Services”
You will see a list of kubernetes services that are running in your environment

Click the link for the “productpage” resource
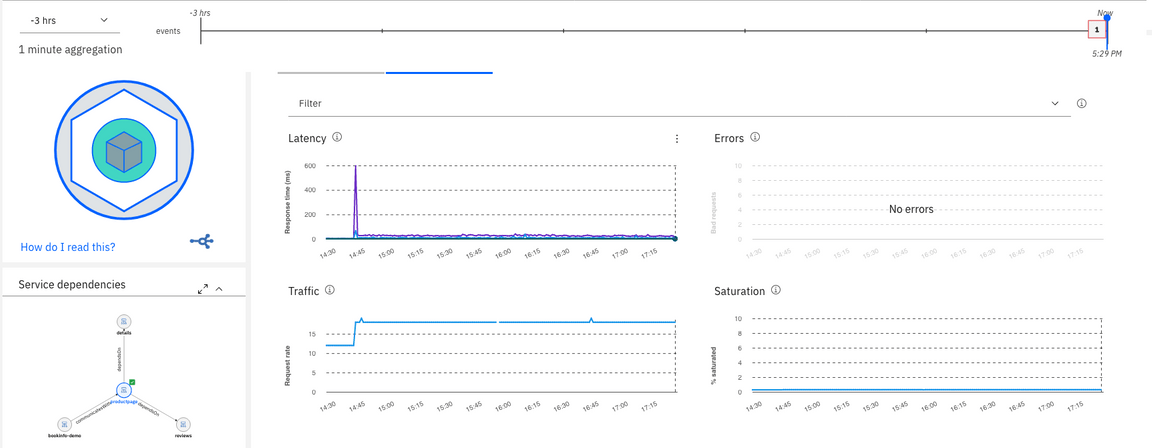
You will navigate to the page for the productpage microservice. Let’s explore this page as seen below
Deployment topology
In the upper left corner, you see the “Deployment topology”. You’ve seen this before in the context of the kubernetes cluster. Now, you’re viewing it in the context of the productpage microservice. What the topology is showing you is that this microservice is deployed to one pod on one node in the cluster. If you scaled out the deployment to 2 pods, then you would see 2 pods in the Deployment topology.
Golden Signals
Next, look at the golden signals on the right side of the page. The 4 graphs labeled Latency, Errors, Traffic, and Saturation are the Golden Signals. These are the most important metrics for Site Reliability Engineering (SRE) as they show the metrics imoprtant from the end-user perspective, that have been normalized for different application/middleware domains. Let’s explore Latency a little more.
Latency
Flyover the Latency Graph. You’ll see a graph showing the latency shown in different percentiles (50th, 90th, and 95th). By using percentiles, you get a much better idea how the applicaiton is performing.
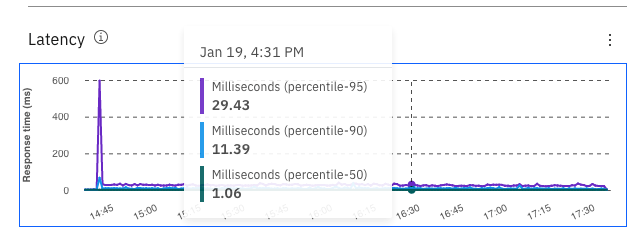
Next, select the dropdown list in the Filter. The default behavior is to show 50th, 90th, and 95th percentile for all URLs. But, sometimes you want to filter the data.
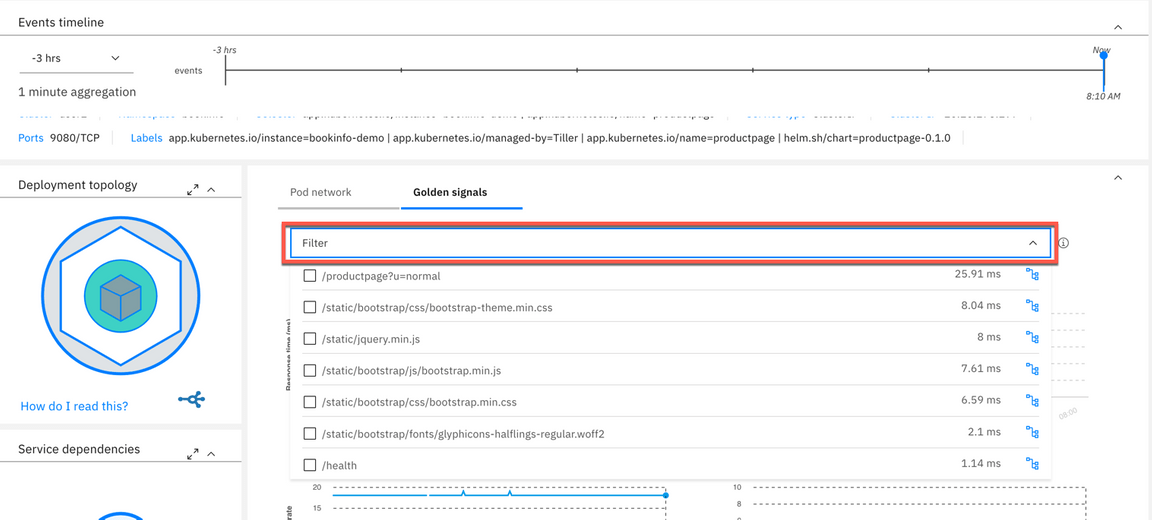
Select 1 or more of the URLs for the productpage microservice
View the latency data for the URLs that you selected.
Within filters, select the icon on the far right for the “/productpage?u=normal” URL.

After you click the icon, you will see some very useful information as seen below. At the top of the page, you see a scatter plot chart that allows you to see a distribution of the requests. This is a very useful way to visualize the transactions because it allows you to see patterns and outliers.
Below that, expand one of the requests and you will see a breakdown of where the request spent its time.
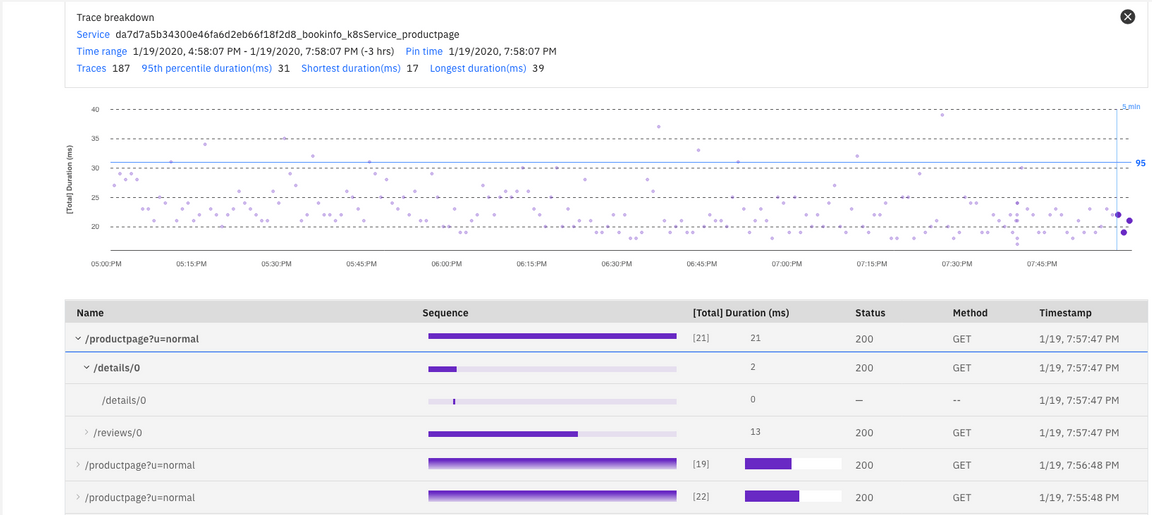
Close the Trace Breakdown window by clicking the “X” in the upper right corner.

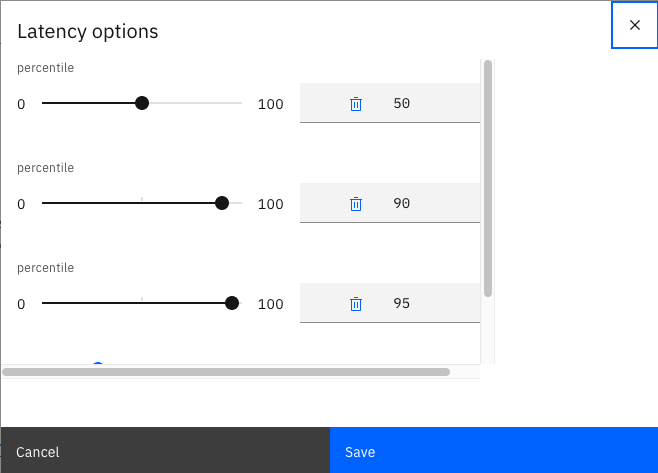
Now, click the 3 vertical dots in the upper right corner of the Latency graph and select “Latency Options”
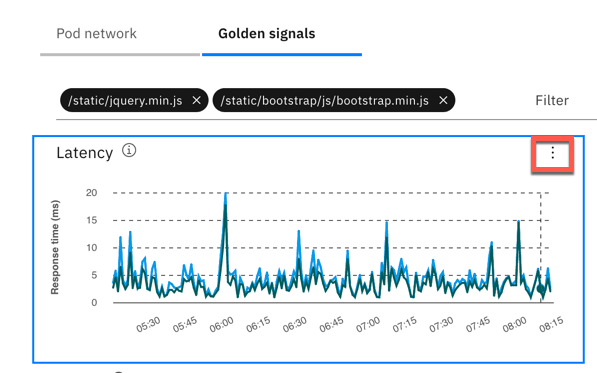
Notice that you can customize the latency options. Either change the latency percentiles or add/delete lines from the graph. Try it out.
Next, examine the Service dependencies
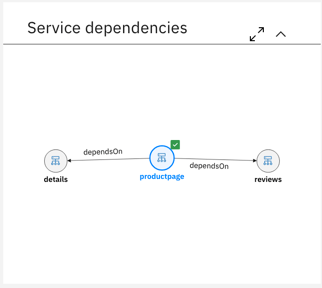
The service dependency shows a 1-hop topology of the microservices. For the productpage service, it shows that there are clients connecting to the service and there is a dependency on “details” and “reviews”.
Click on “reviews” icon. You will navigate to that microservice and see the 1-hop topology for the “review” service. Examine the golden signals for the “reviews” service.
Full Service Topology
Most of the time, the 1-hop topology is good enough to diagnose the root cause of a problem. But, sometimes you need to see additional information. Click the “expand to the full screen” icon in the upper right corner of the service dependencies to expand the view.
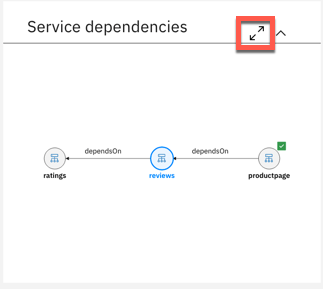
The view you see comes from an embedded capability called Agile Service Manager (ASM). ASM allows you to expand to more than hop in the topology. It also allows you to visualize changes that are occurring in the application. Since change introduces most of the problems in IT, this is a powerful capability.
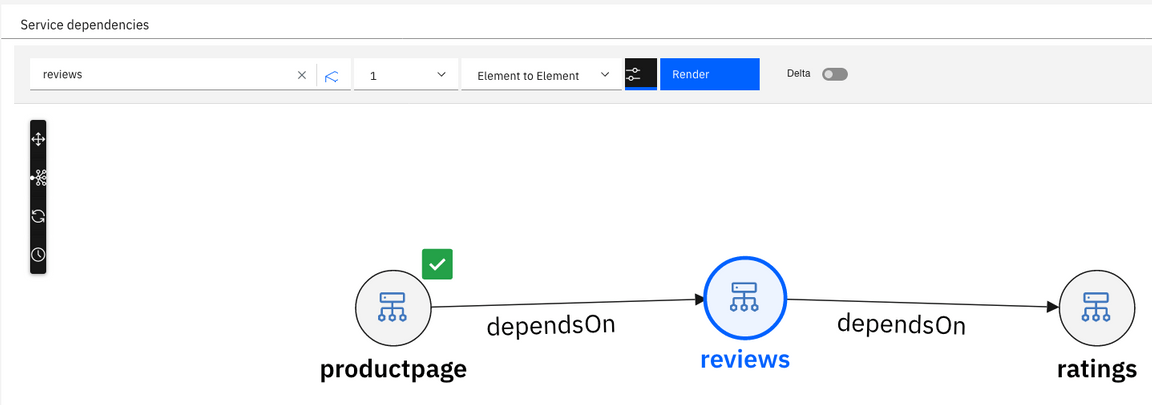
Let’s start by switching to a 2-hop topology. Select the dropdown in the top-middle of the screen and change the value to “2”. Then click “Render”

We won’t examine it here, but ASM allows you to hide/show some additional objects in the topology. In this topology, you see the microservice topology. If you want, you can add the pods into the topology. To add/hide elements on the page, click the Filter icon to the left of the “Render” button.

ASM has powerful capabilities to show you what’s changing. This includes topology changes, state changes, and property changes. We won’t be exploring that capability since there haven’t been any changes to the application. Feel free to explore additional ASM capabilities. When you are done exploring, you can click on one of the icons for the microservices and you will navigate back to the Golden Signal view.
Drill Down into the Runtime
Sometimes you need additional details that can only be gathered from the data collector that is running within the runtime. If the app server (python, Node.js, JVM, golang) is instrumented with a lightweight data collector, you can click on the container and drilldown into the runtime metrics.
Click on the “container” in the Deployment topology.
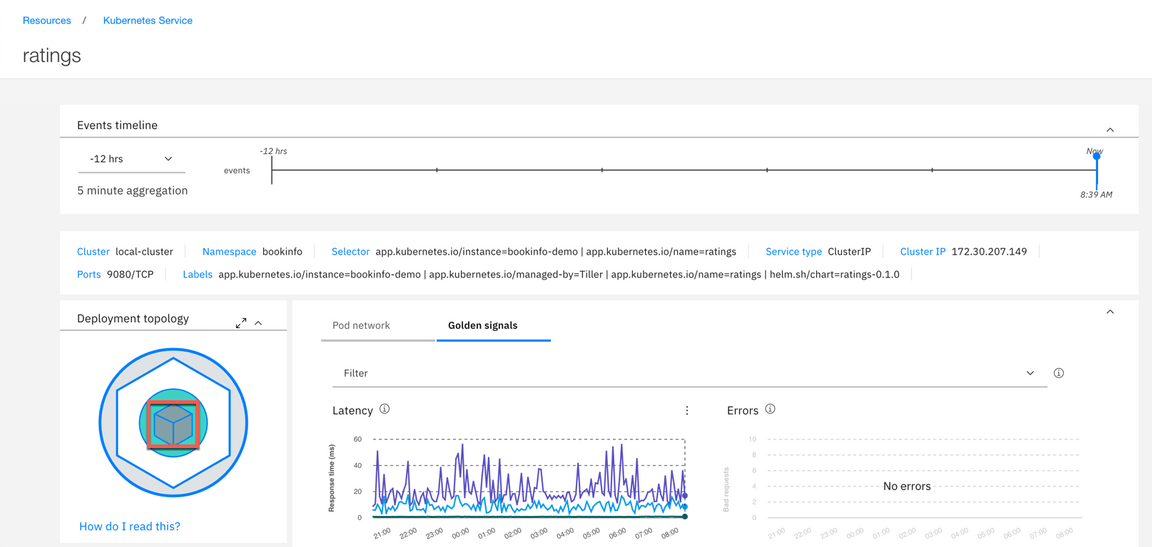
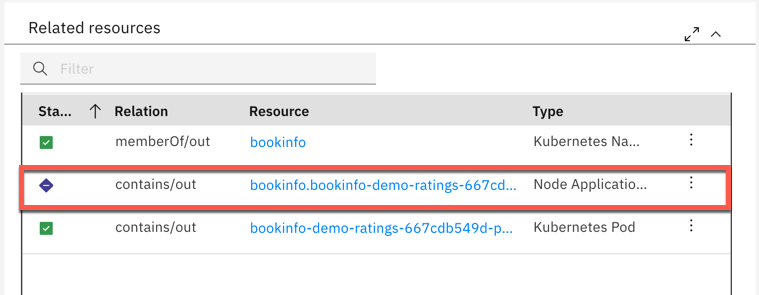
You are now viewing the detailed container metrics for this microservice. To navigate to the detailed metrics reported by the data collector, scroll down and click the appropriate name in Related resources window.
The runtime page shows selection of most important metrics for a selected runtime type
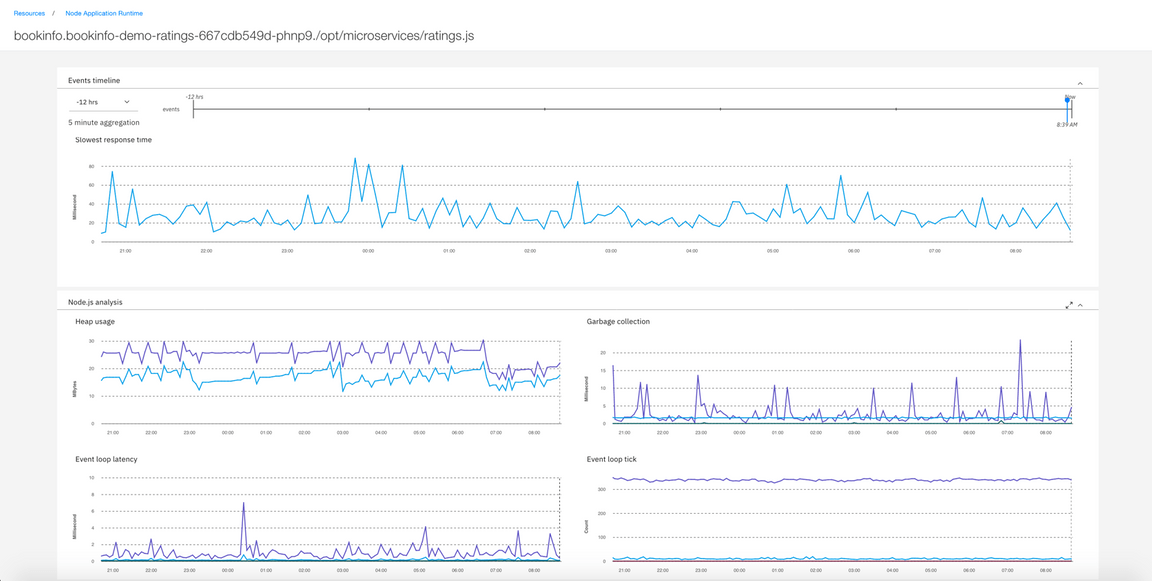
To expore any other metric, scroll down the page and expand the Custom metrics section, picking the metric you want and additional filtering and display options.

This concludes the exercise. You now understand how to naviagate Golden Signals view.
Additional resources:
Summary
You completed the Cloud Pak for Multicloud Management tutorial: Monitoring and using SRE Golden Signals. Throughout the tutorial, you explored the key takeaways:
Understand Cloud Pak for Multicloud Management Monitoring moduleLearn how to add cloud native monitoring to the managed clusterlearn how to gather monitoring metrics from the managed clusterLearn how to use SRE Golden Signals to monitor application running on the managed cluster
If you would like to learn more about Cloud Pak for Multicloud Management, please refer to:
