Access backend systems using APIs and Messaging
- Lab Overview
- Prerequisites
- Configure IBM MQ
- Working with App Connect Enterprise toolkit
- Deploying a BAR file
- Using Operational Dashboard
- Summary
Author(s): Carlos Hirata, Ravi Katikala
Last updated: April 2021
Duration: 45 mins
Lab Overview
In this tutorial, you use the Cloud Pak for Integration 2021.1.1 to create an App Integration flow (IBM App Connect Enterprise) that sends messages to a queue (IBM MQ) on OpenShift 4.6.
Takeaways
- Configuring IBM MQ
- Creating an integration flow that connects to a message queue
- Deploy the integration flow as a container in Kubernetes
- Checking the message using MQ Web Console
- Checking this message using Operational Dashboard (tracing)
Prerequisites
- You need to have your personal CP4I on ROKS environment. Check here how to request it
- You need to have the OC CLI and you should have logged in your ROKS cluster via command line. Check here how to do it
- You should have an MQ Queue Manager runtime pre-created in your CP4I on ROKS environment.
- You need to have the IBM App Connect Enterprise Toolkit installed in your desktop. Follow the sections Download IBM App Connect Enterprise for Developers and Install IBM App Connect Enterprise from this tutorial to install it.
Configure IBM MQ
Task 1 - Configure Message Queue (IBM MQ) to Authorize and Accept Data
As this is a brand-new deployment of the Cloud Pak for Integration, all instances of integrations, message queues, and APIs are deployed as microservices. You need to authorize the Message Queue service to accept incoming data from the integration running on a separate server.
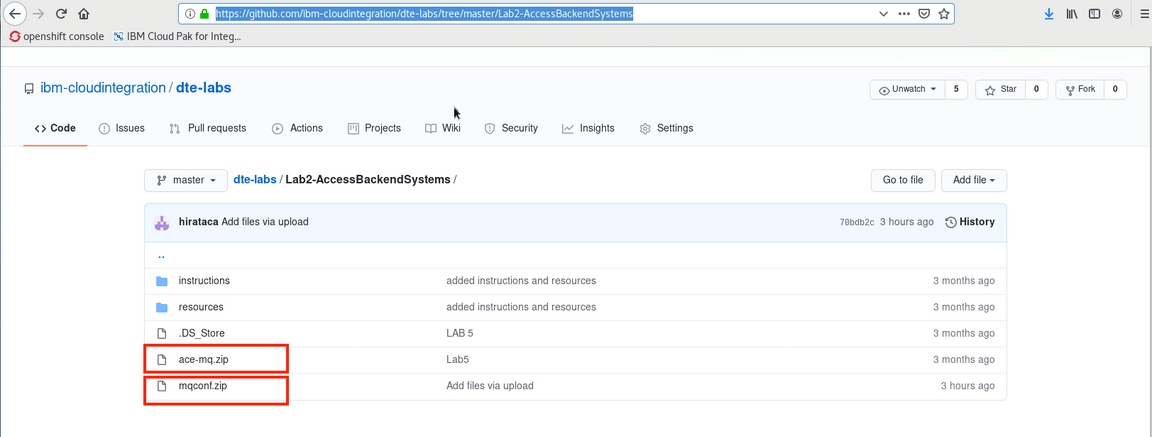
1.Let’s configure the MQ security. Open a browser and go to https://github.com/ibm-cloudintegration/dte-labs/tree/master/Lab2-AccessBackendSystems/resources.
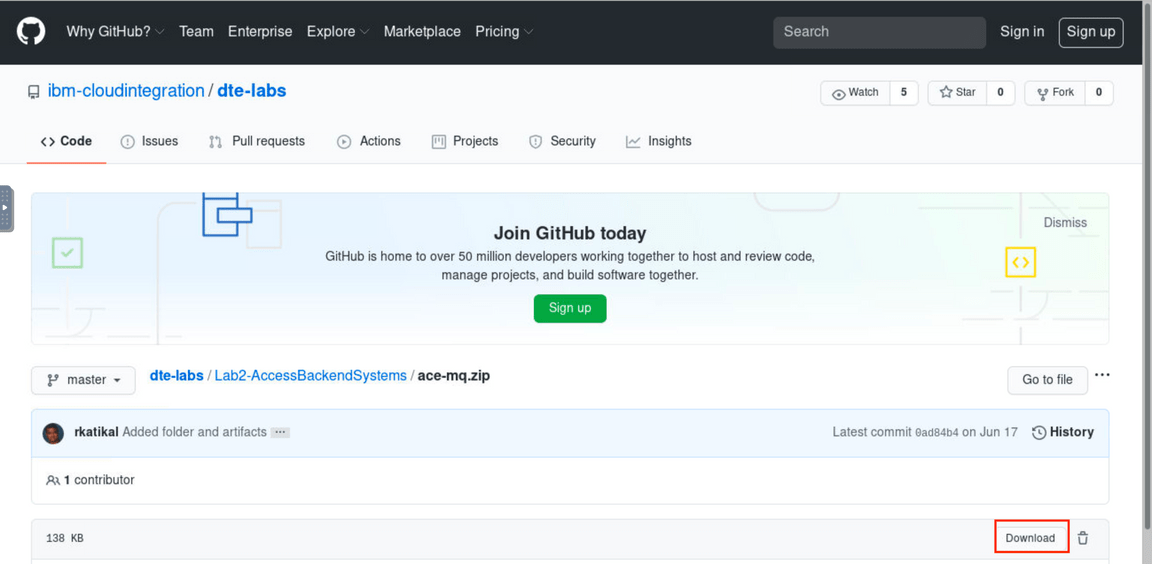
2.Click Download for both zip files.

3.Open a terminal window and enter unzip es-mq.zip. Unzip creates a directory mqconf.zip ~/Downloads/ directory. Do not unzip ace-mq.zip (this is a App Connect Interchange Project).
 )
)
4.In terminal window, find the mq pods, using this command: oc get pods | grep mq. Copy the mq pods (mq-quickstart-ibm-mq-0).
 )
)
5.Execute the shell script to run MQ configuration (update the channel and security). Go to ~/Downloads/mqconf directory and enter ./loadmq.sh mq-quickstart-ibm-mq-0. The MQ configuration will be updated for this lab.
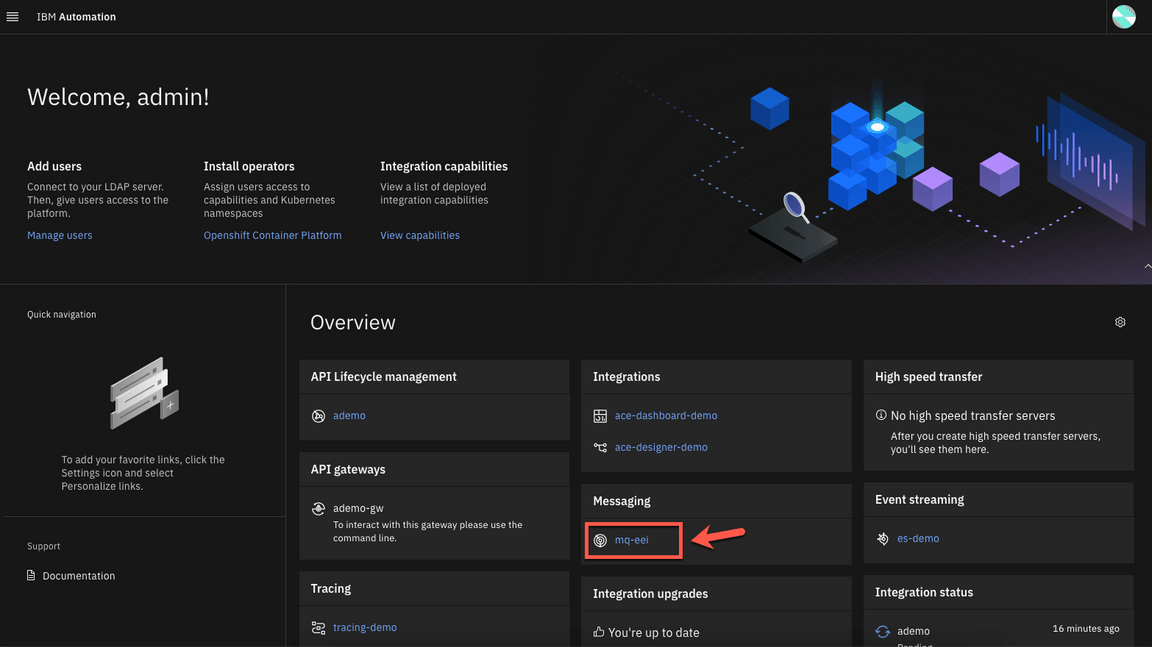
6.Open a browser and go to your Cloud Pak for Integration Platform Navigation. From here, you are able to navigate to all the integration runtimes and capabilities available in the platform. Capabilities include: API Connect, App Connect Dashboard, App Connect Designer , Asset Repository and Operations Dashboard. Let’s explore the Message Runtime. IBM MQ for Cloud Pak for Integration has a web GUI, which the Integration Developer, with security authorization, is able to manage the different MQ objects (queues, channels, topics and so on). On the Cloud Pak for Integration Home, scroll down to see the Message box, and click to open your MQ Queue Manager Runtime.
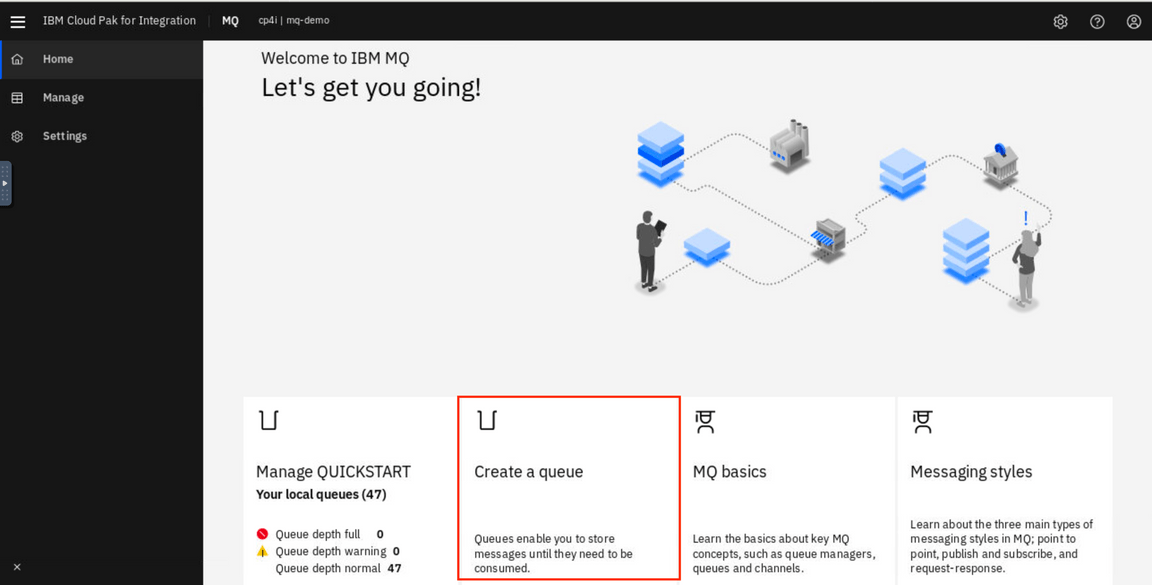
7.Now you are on the IBM MQ Welcome Page. Let’s create a queue: click Create a queue.
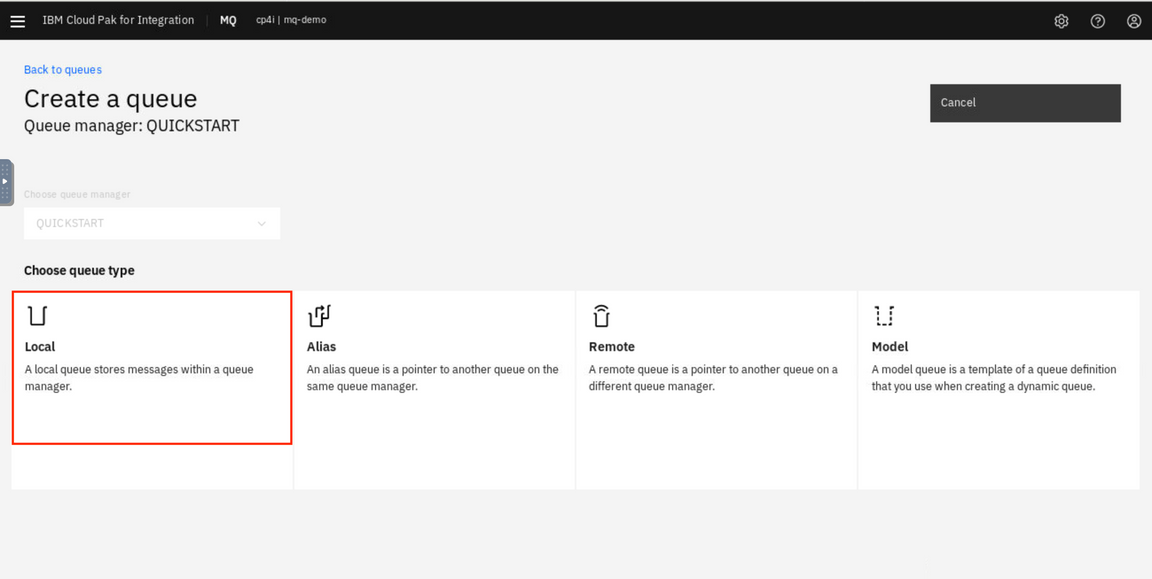
8.In Create a queue page. Choose Local as your queue type.
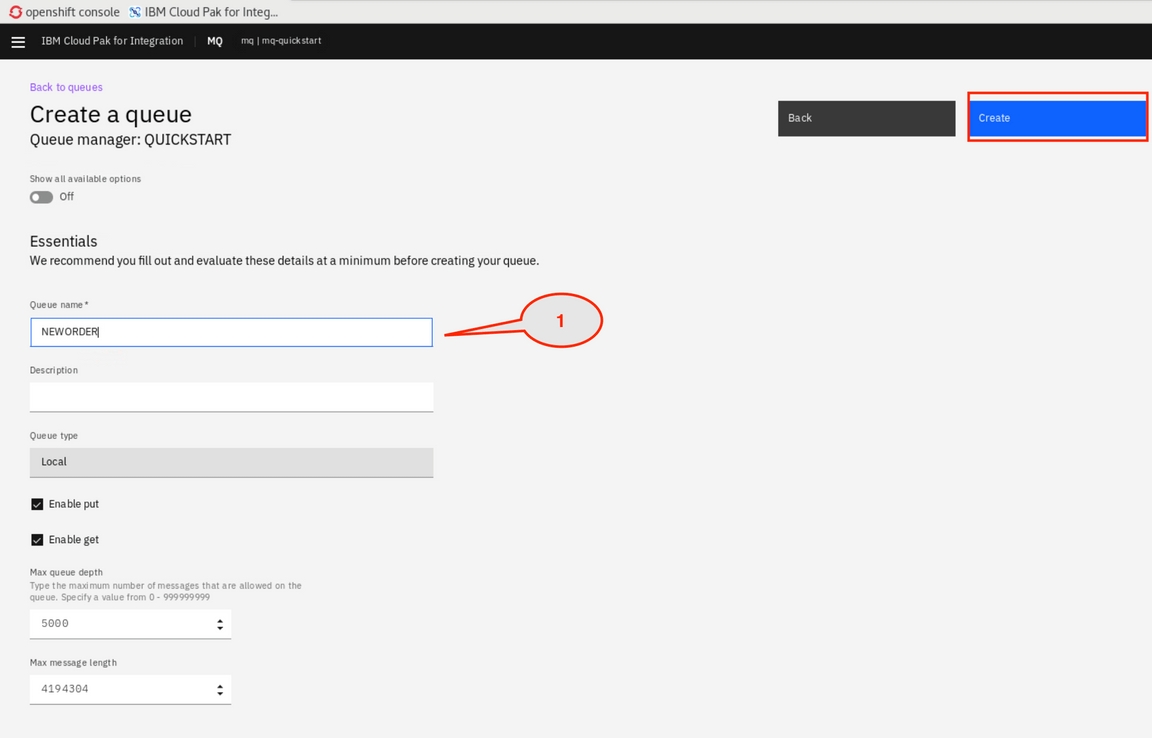
9.Enter the queue name: NEWORDER, keep the default values and the click Create.
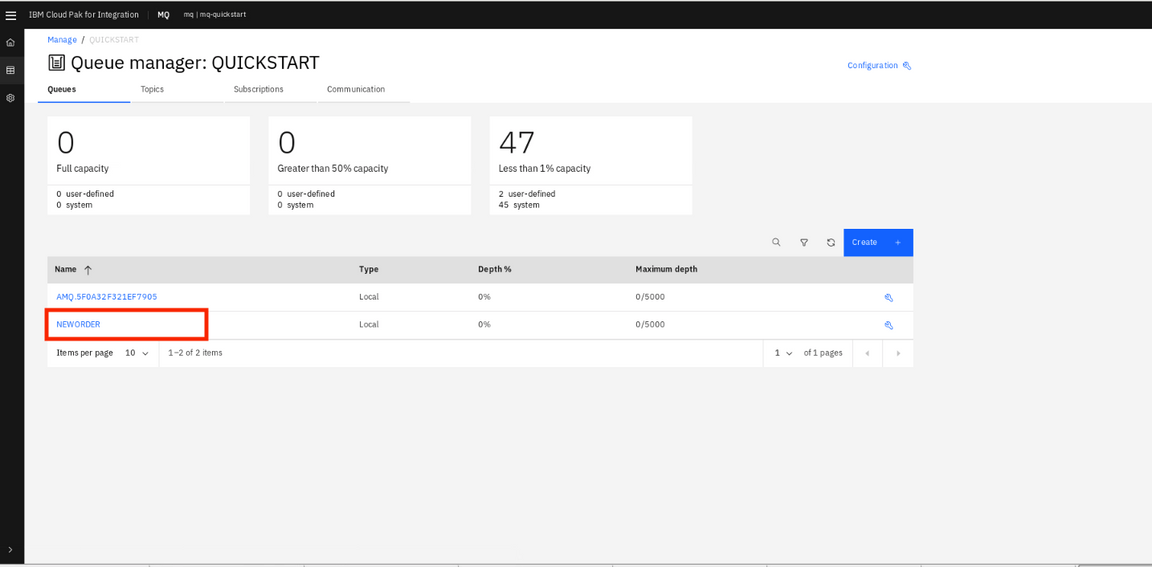
10.In the Manage page, locate the queues and click NEWORDER queue link.
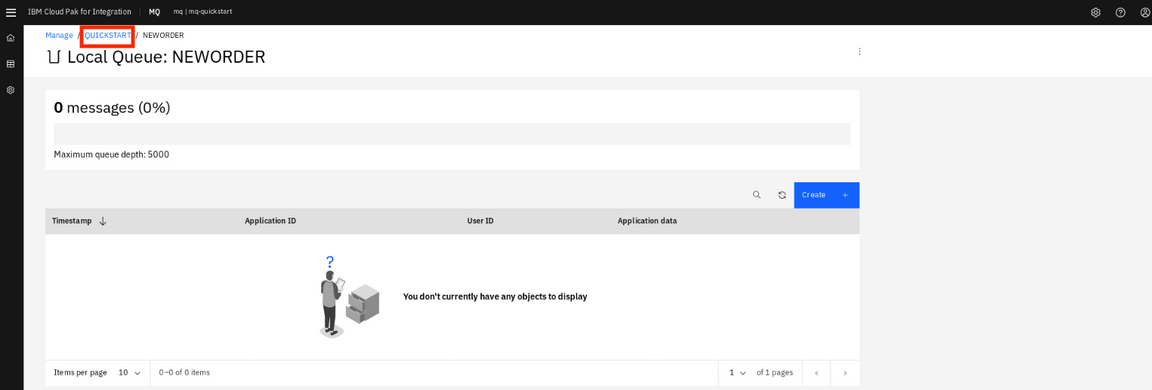
11.Here, you can see that the NEWORDER queue is empty. Ok, let’s return to the queue manager screen. On the breadcrumbs, click QUICKSTART link.
Working with App Connect Enterprise toolkit
Task 2 - Configuring the app integration flow
In this task, take an existing integration flow in ACE and modify it to send only the payload data to the NEWORDER queue.
1.Open a Terminal window.
2.Before starting App Connect Enterprise toolkit, let’s check IBM MQ IP address. In th terminal window, enter the OpenShift command, oc get svc -n cp4i | grep mq to get a list of services in the namespaces. and copy the IP address (172.30.152.157) which the port is 1414.

3.Open your App Connect Enterprise Toolkit by clicking the icon on the Launchapad (MAC OS) or Desktop (Windows) or executing ace toolkit in terminal window.
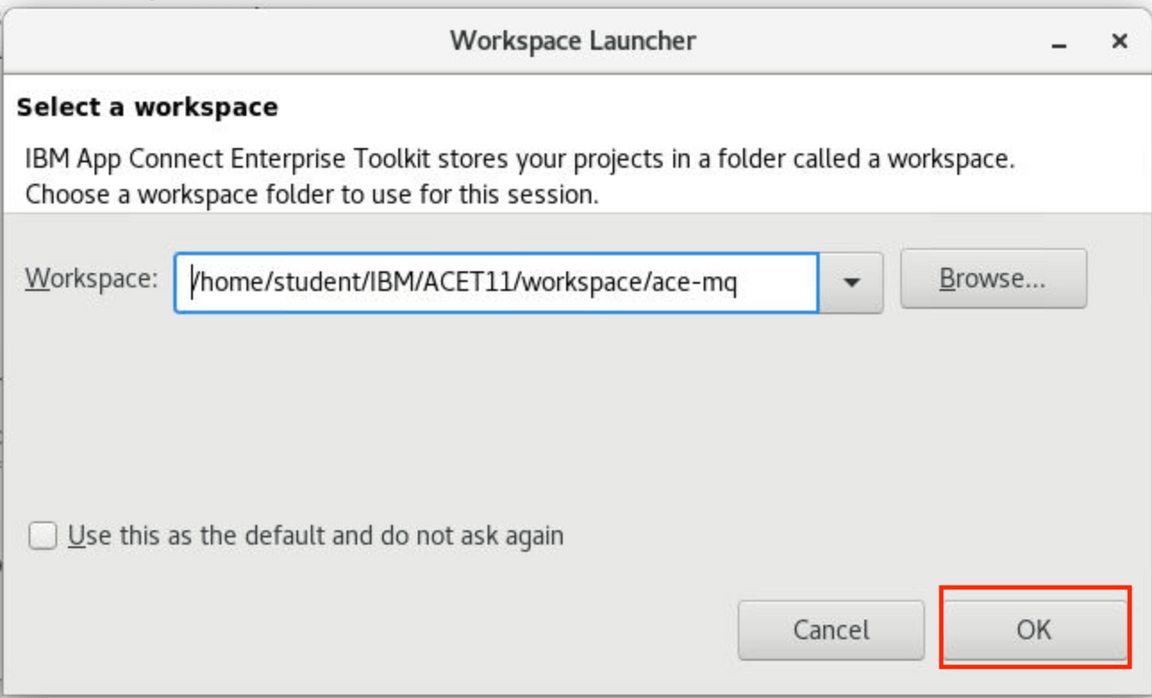
4.In the Workspace Launcher window, create the workspace /IBM/ACET11/workspace/ace-mq. Click OK.
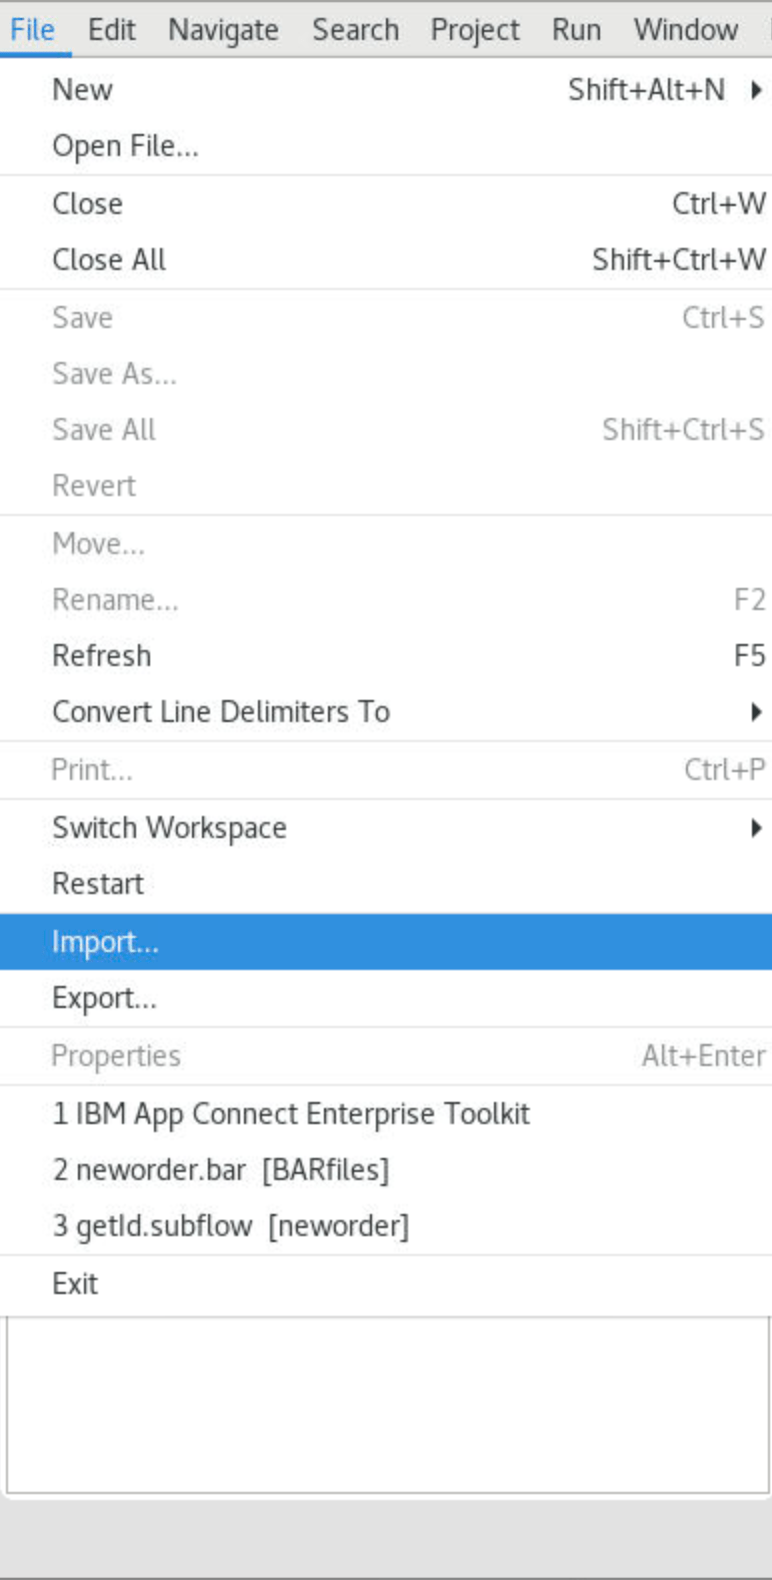
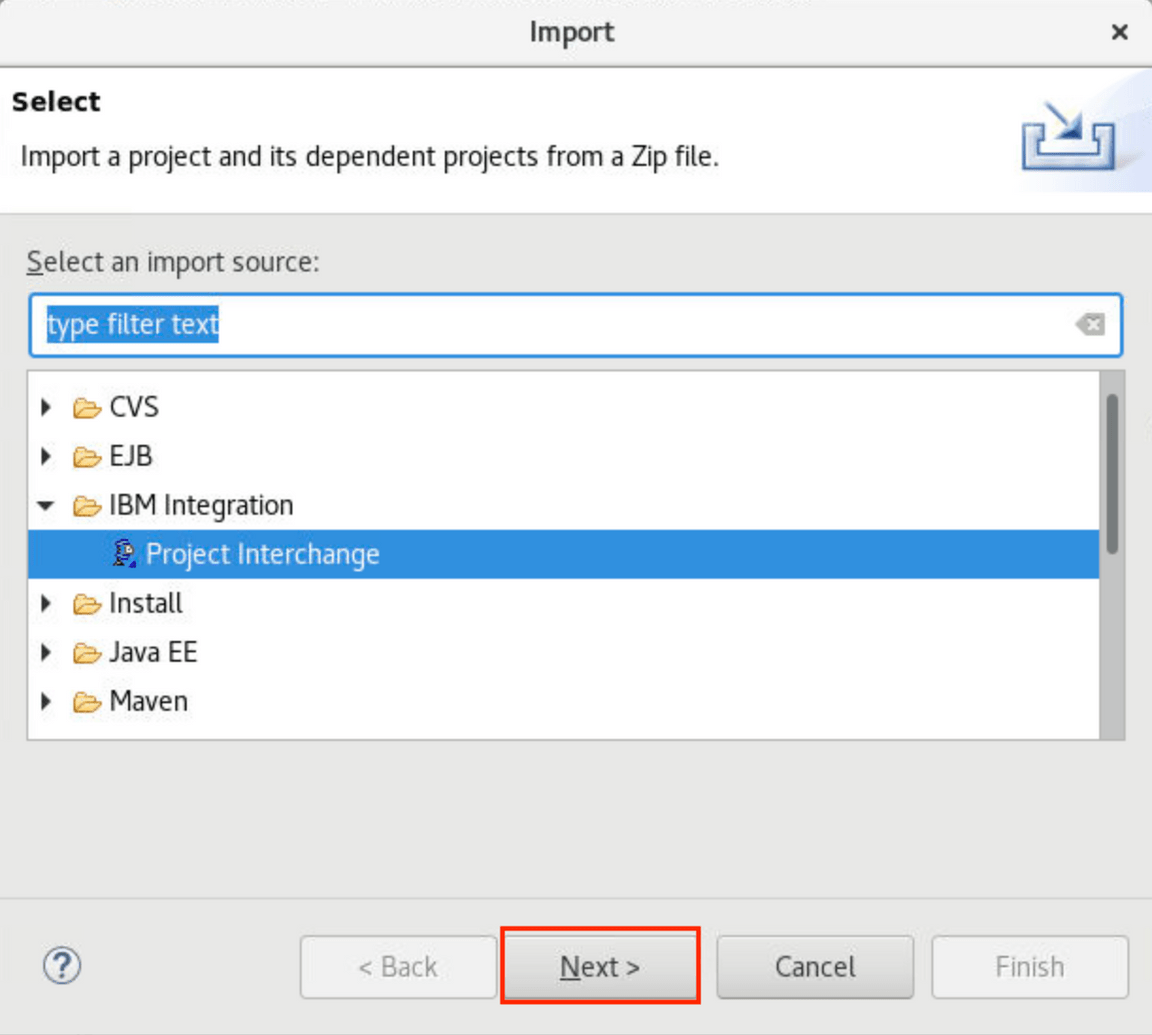
5.The toolkit opens the project (if necessary closes the Welcome screen). Now, let’s import the ace-mq.zip file that you downloaded ( available on ~/Downloads/ace-mq.zip ). Select File->Import->Project Interchange and click Next.
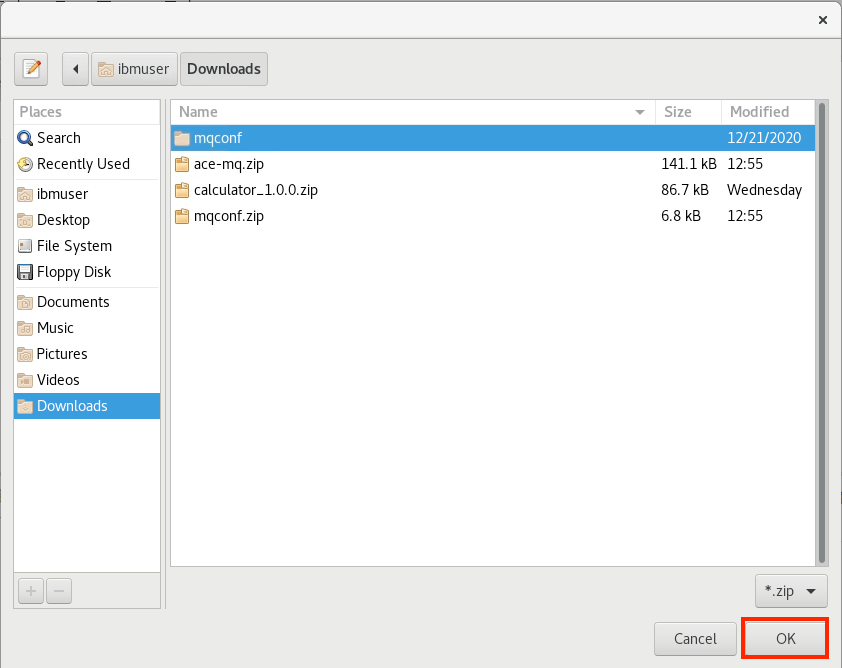
6.Select ace-mq.zip in Downloads folder and then click Ok.
7.Verify neworder project is checked and click Finish. To view the integration flow that you deploy, click neworder -> Resources -> Subflows -> getid.subflow.
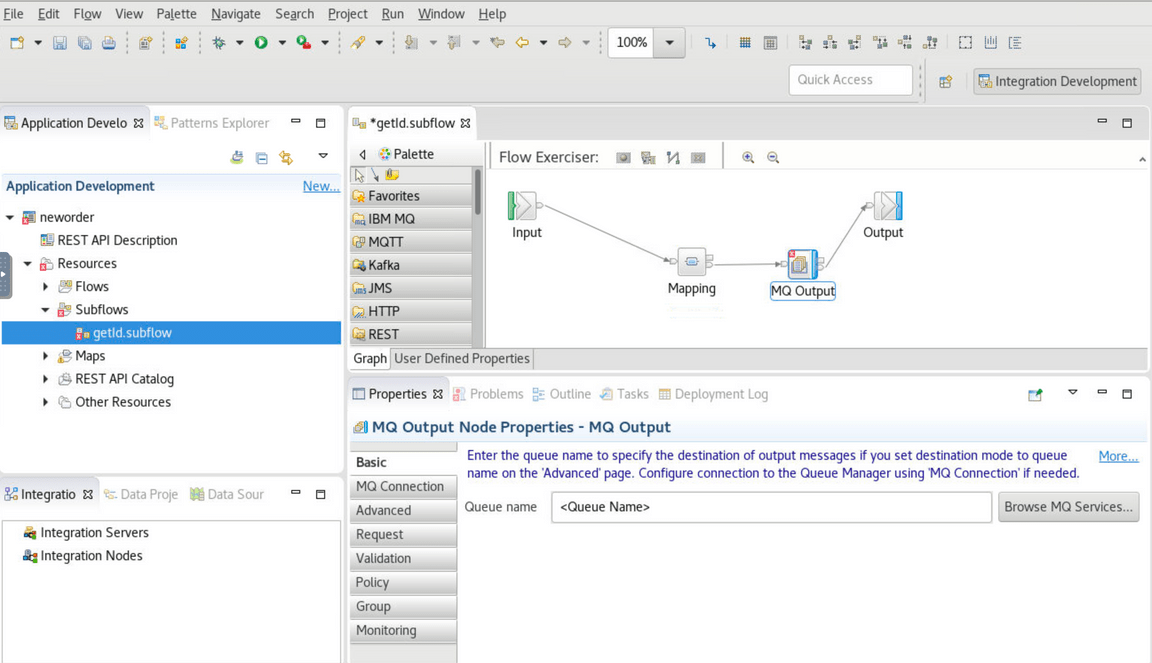
8.Click the MQ Output tile. In the lower-right of the Properties pane, open the Properties tab and click Basic. Enter the queue name: NEWORDER.
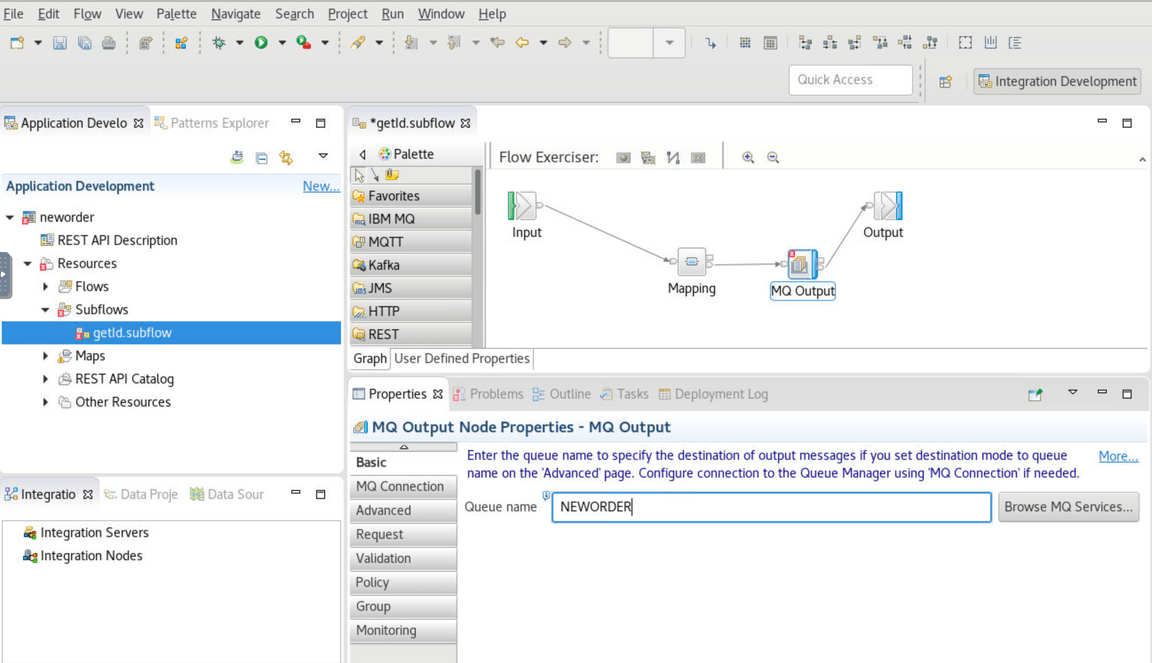
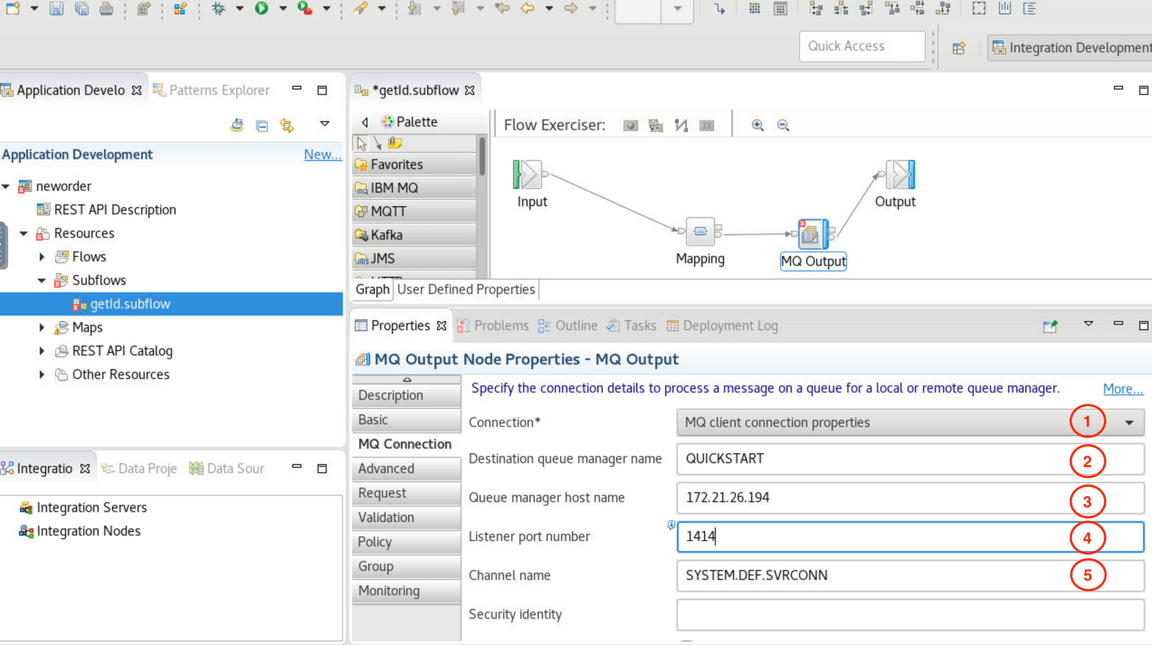
9.Open the MQ Connection tab. On the Connection field, select MQ client connection properties (1). On Destination queue manager name, enter QUICKSTART (case-sensitive) (2). On Queue manager host name, enter the MQ ip identified in the previous step, when you entered oc get svc (3). On Listener port number, enter 1414 (4). On Channel name field, enter SYSTEM.DEF.SRVCONN (5). Save the flow (CRTL+S).
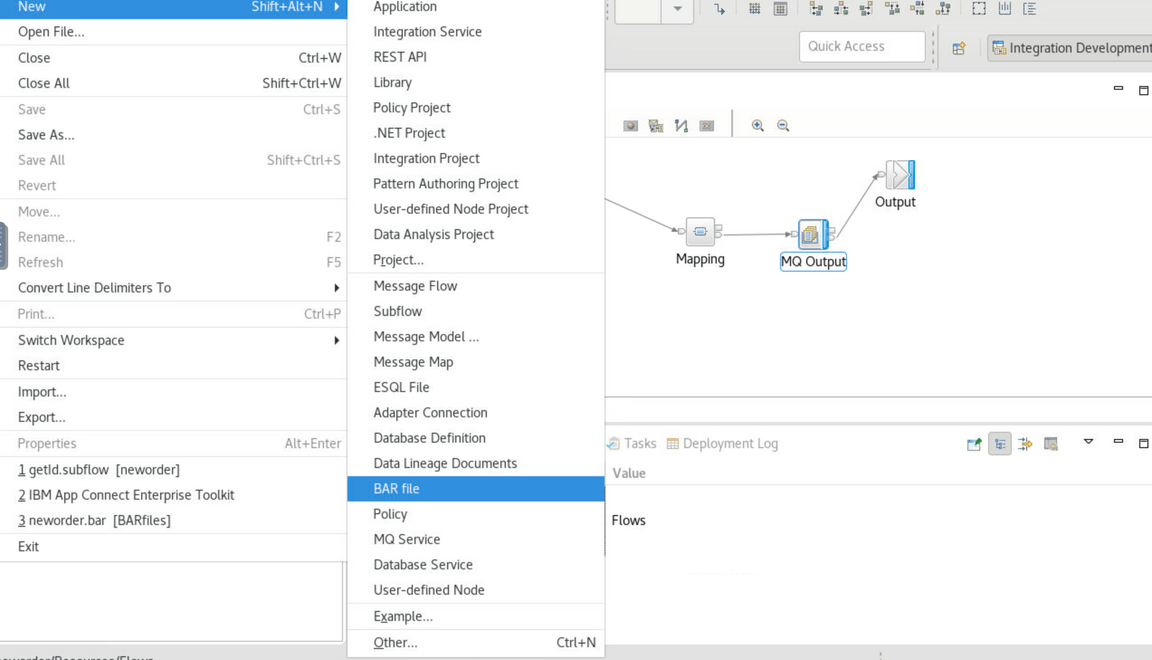
10.Now, you need to generate a BAR (broker archive) file. The App Connect Enterprise server uses BAR files to save compiled message flows, libraries, etc. In the Application Development window in the upper-left, on neworder application, right-click and select New then BAR file.
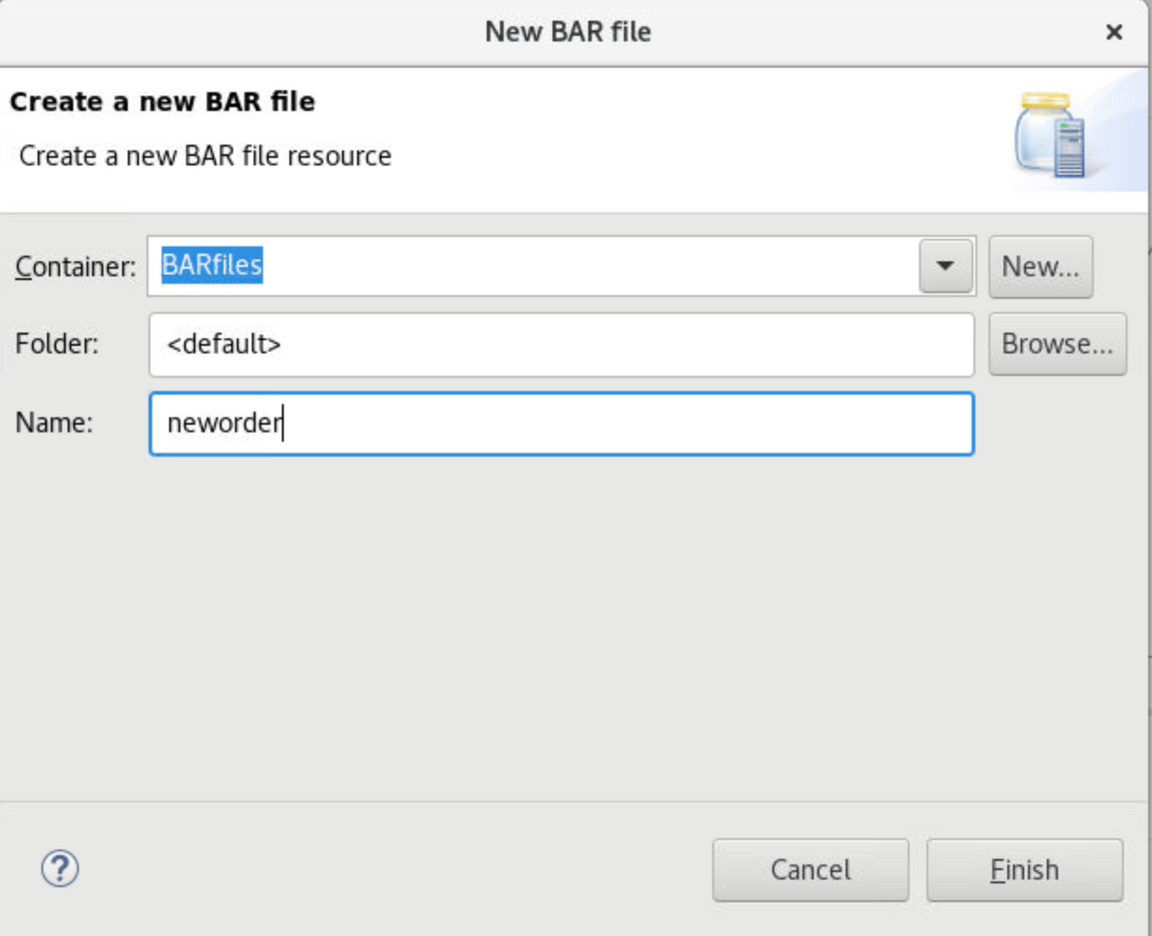
11.On the Window New Bar file, type the name of bar file: neworder.
12.On the Prepare screen, mark the REST APIs checkbox (1). Check Compile and in-line resources (2). Click Build and Save (3). Now, a popup window displays Operation completed successfully. Click Ok.
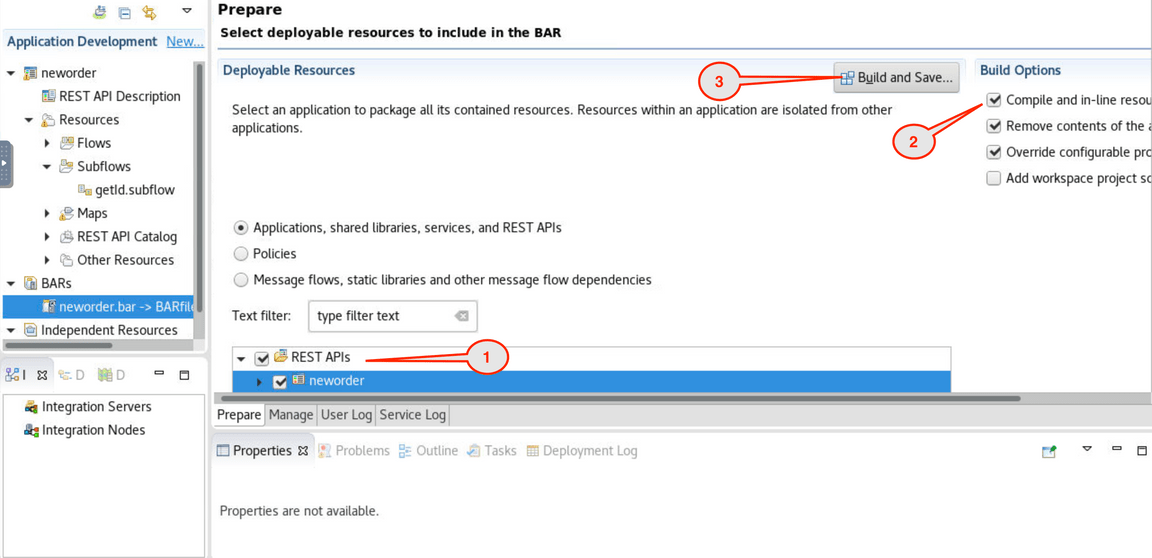
Congratulations! You have the BAR file. Next section you will deploy the file as container in Cloud Pak for Integration. Now, you are welcome to close the Toolkit.
Deploying a BAR file
Task 3 - Deploy Integration BAR file as containers
In this task, deploy the integration flow as App Connect Enterprise containers running in Kubernetes on the Cloud Pak for Integration. You then test the integration API by calling the API to create a new order and confirm the response payload and data in the queue.
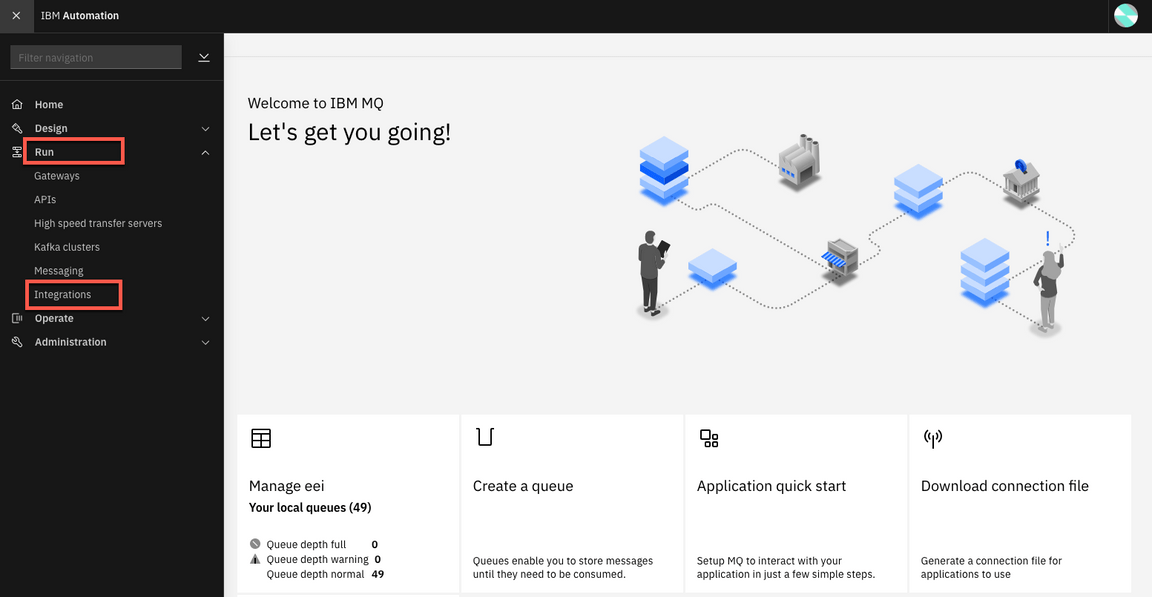
1.Back to the Cloud Pak Platform Navigator in the browser. Open the Menu and on the Run section, open the Integrations dashboard.
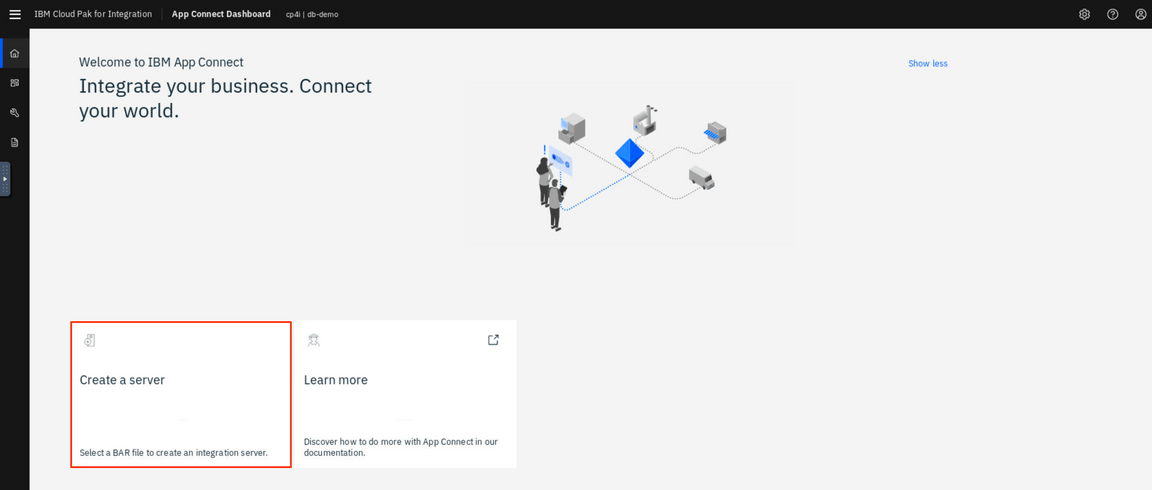
2.To deploy a BAR file, you need to create an Integration server. Let’s do it! Click Create a server.
3.In the Create an Integration Server page, you have two options to deploy a BAR file: Deploy a BAR file from App Connect Toolkit or from App Connect Designer. In this lab you use the App Connect Toolkit. Select Quick start toolkit integration option and click NEXT.
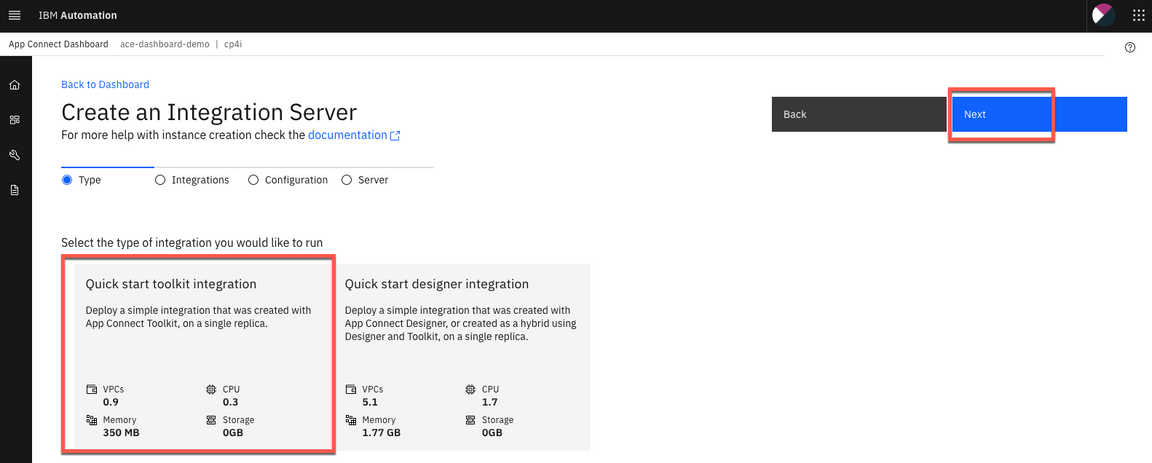
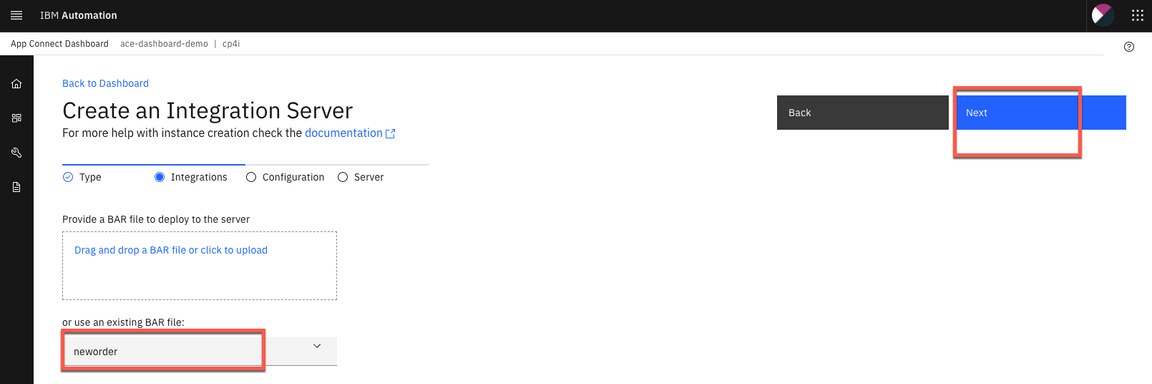
4.Click to upload your BAR File. And select the neworders.bar (~/IBM/ACET11/workspace/ace-mq/BARfiles). And click Next.
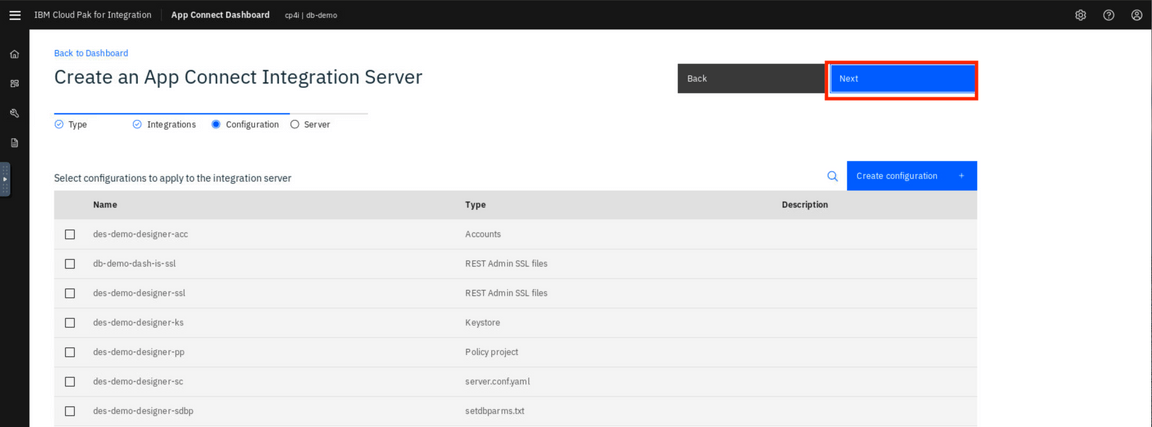
5.You do not need to use the configuration package (configuration package contains the files that you can use for App Connect Enterprise works with Databases, Event Streams, etc) click Next.
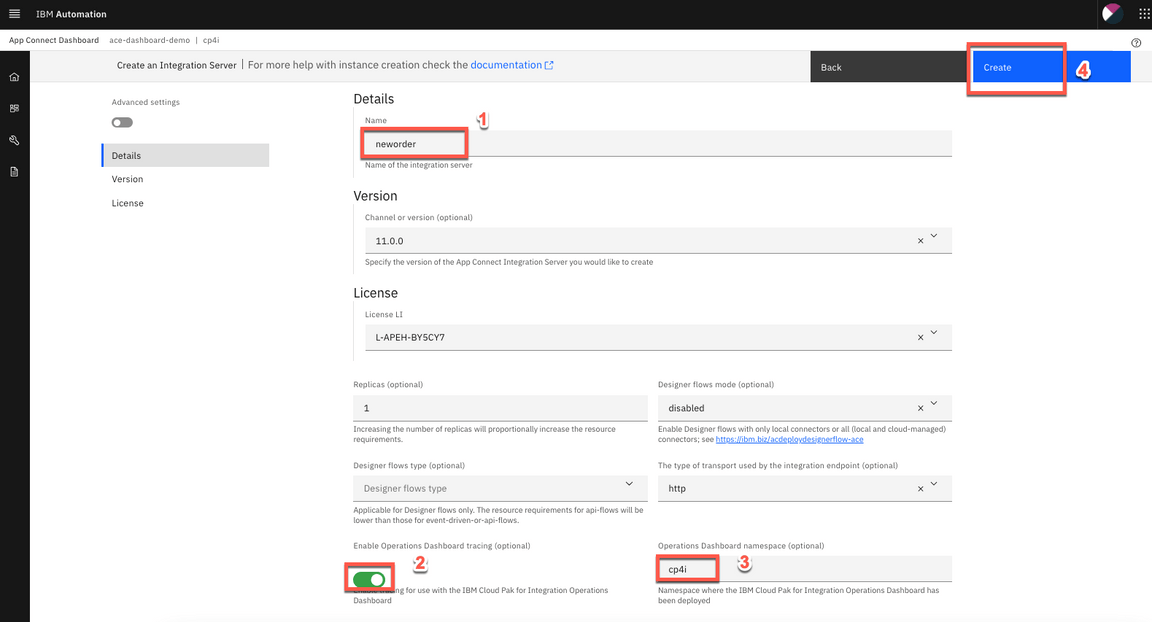
6.On Create an Integration Server page, enter the Integration Server name as neworder (1). Switch to ON to use Operations Dashboard tracing (2). Enter Operational Dashboard instance namespace as cp4i (3). Then click Create (4).
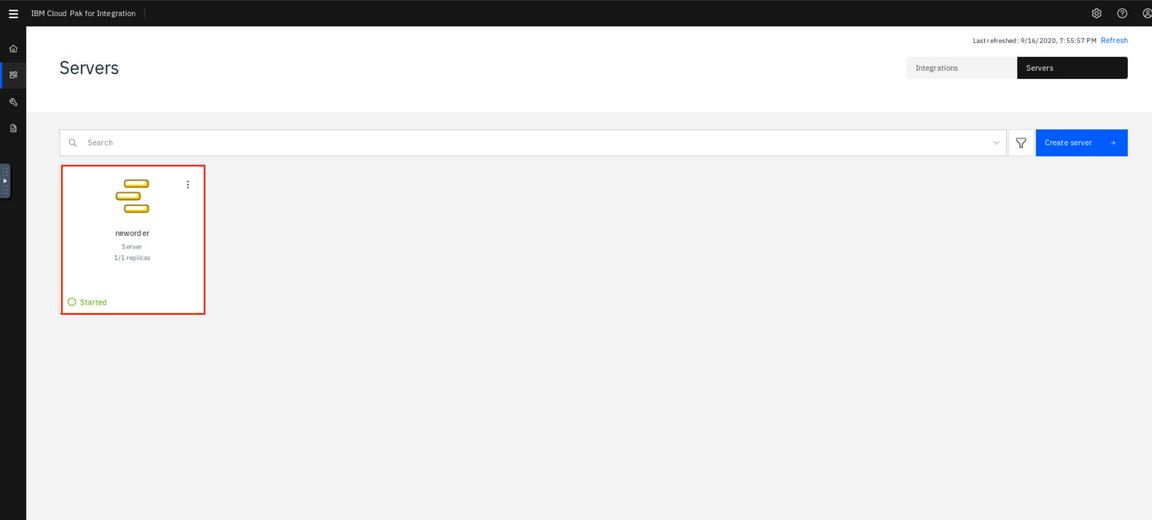
7.Here you can see the App Connect Enterprise Dashboard with the Integration Server neworder deployed and started. Click the neworder server icon.
Note: The deployment process takes up to 5 minutes, refresh the browser to see the BAR file deployed and started.
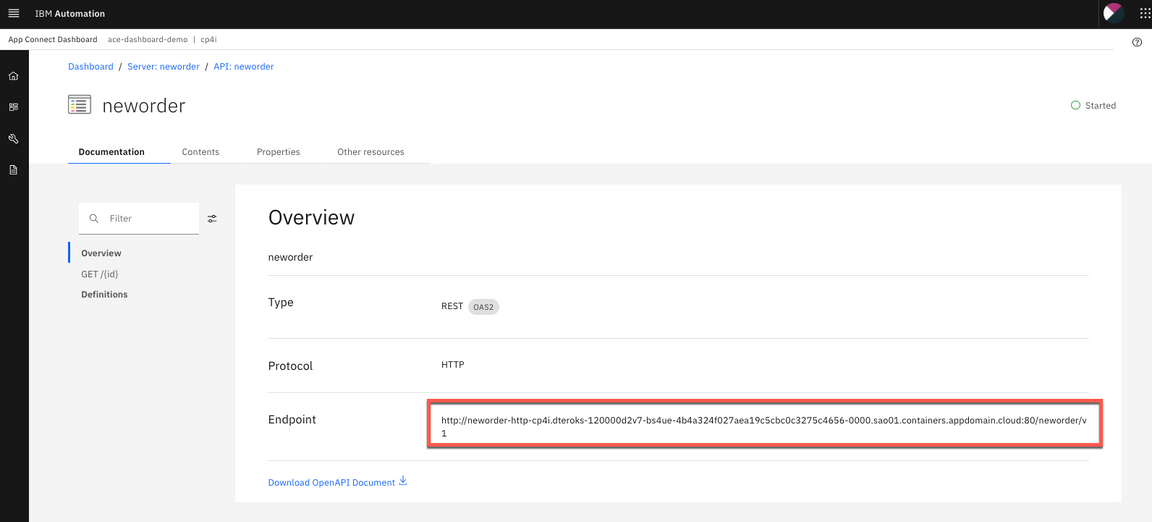
8.Click the neworder API icon.

9.This page displays the Endpoint URL (for example : http://neworder-http-cp4i.mycluster-dal12-c3c-32x-4e85092308b6e4e8c206c47df210f622-0000.us-south.containers.appdomain.cloud:80/neworder/v1/). In this page, you can download a swagger file. But in this lab, you just need the Endpoint URL.
10.Now let’s test it. Open a terminal window and enter the curl command below:
curl -G -k http://neworder-http-cp4i.mycluster-dal12-c3c-32x-4e85092308b6e4e8c206c47df210f622-0000.us-south.containers.appdomain.cloud:80/neworder/v1/00000
Note: Replace the API URL with your Endpoint snd don’t forget to include 0000 as order number at the end of the URL.

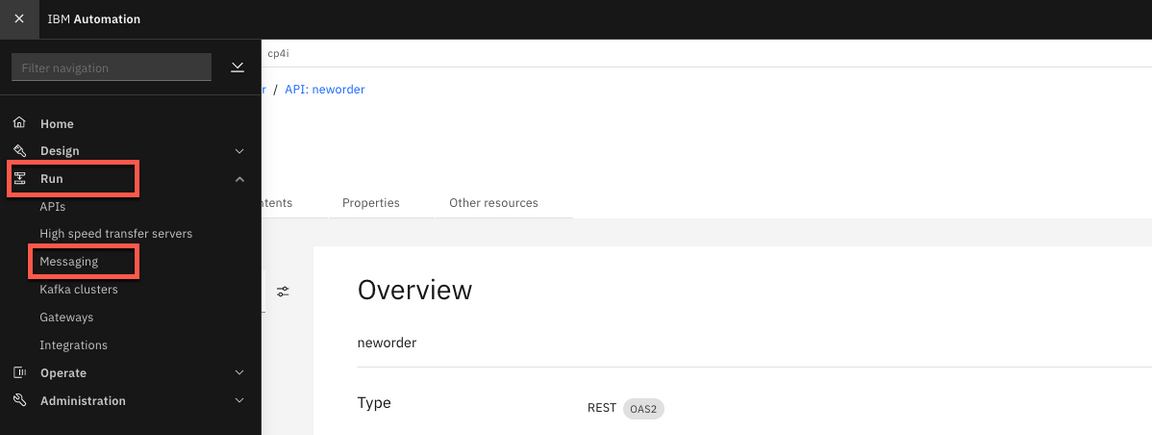
11.Now, let’s check the message arrived in the NEWORDER queue in IBM MQ. Let’s use IBM MQ Console to check it. Open the Menu again, and on Run section, click on Messaging.
12.Click Manage QUICKSTART.
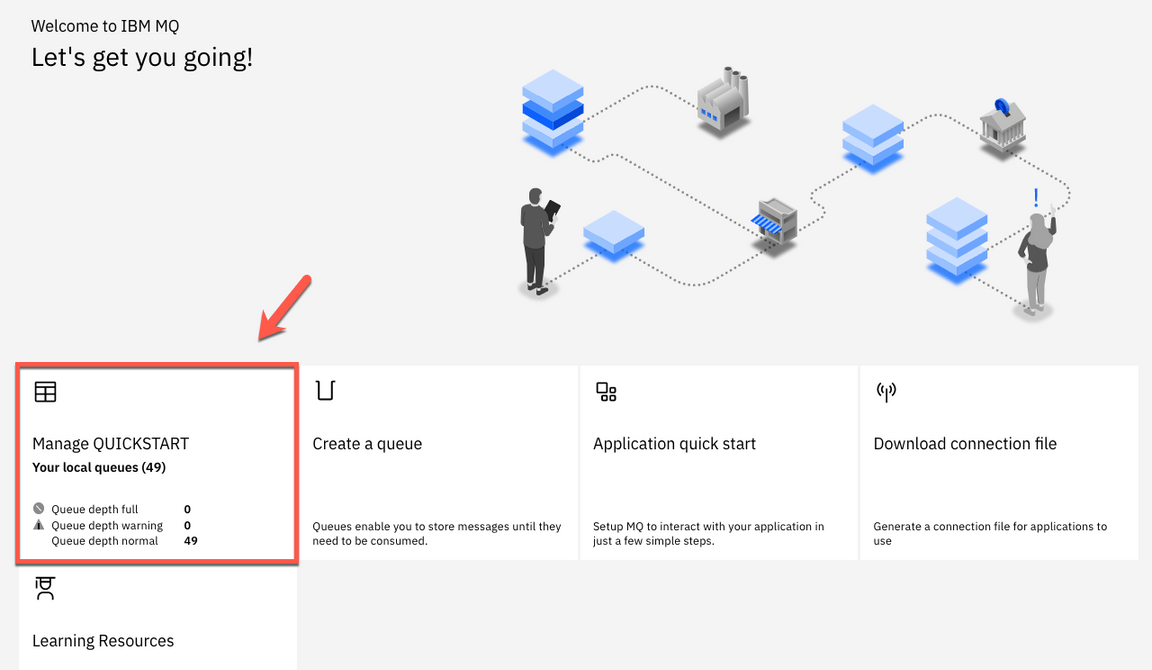
13.Here you can see that a new message has arrived in NEWORDER queue.
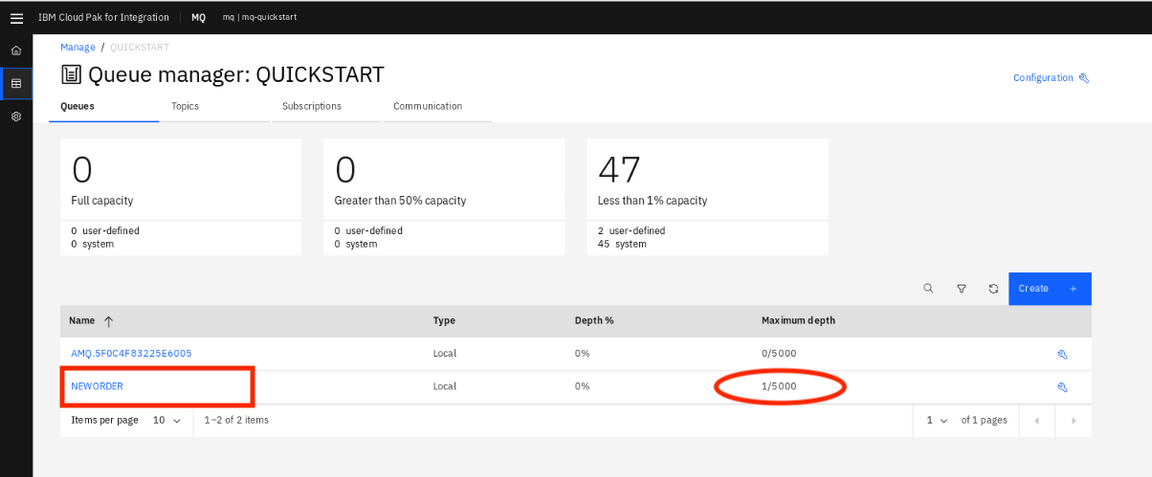
14.You are welcome, to click on the NEWORDER queue, to explore the message.

Using Operational Dashboard
Cloud Pak for Integration - Operations Dashboard Add-on is based on Jaeger open source project and the OpenTracing standard to monitor and troubleshoot microservices-based distributed systems. Operations Dashboard can distinguish call paths and latencies. DevOps personnel, developers, and performance engineers now have one tool to visualize throughput and latency across integration components that run on Cloud Pak for Integration. Cloud Pak for Integration - Operations Dashboard Add-on is designed to help organizations that need to meet and ensure maximum service availability and react quickly to any variations in their systems.
1.Let’s explore the Operations Dashboard. Open again the Menu, and on the Administration section, open Integration capabilities.
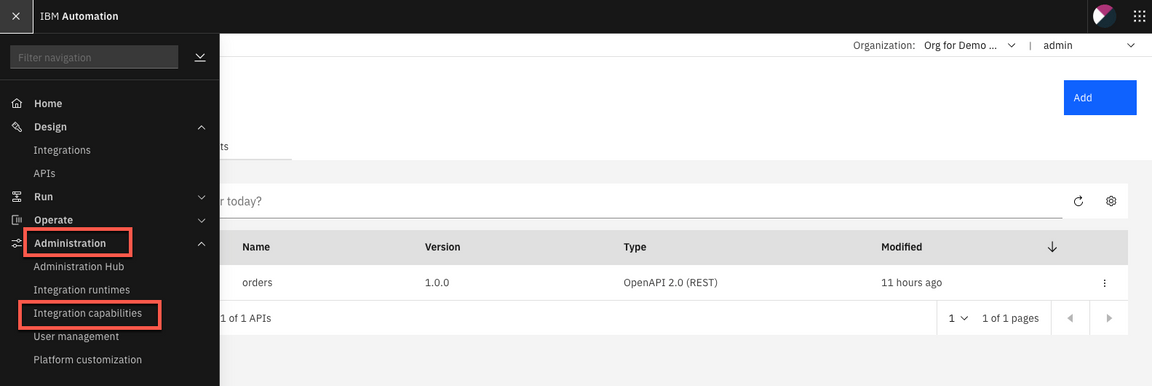
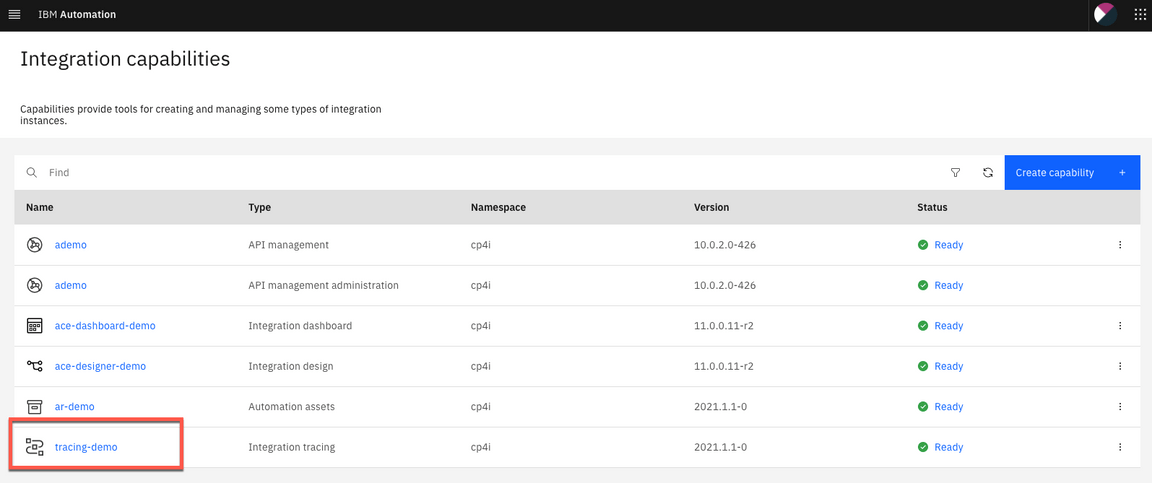
2.From the Capabilities list, open Integration tracing link: tracing-demo.
3.In the Tracing page, check the Overview page. Here you are able to select the product that you want to trace: APIC ,APP Connect and MQ. (more tracing products will add in the future releases).
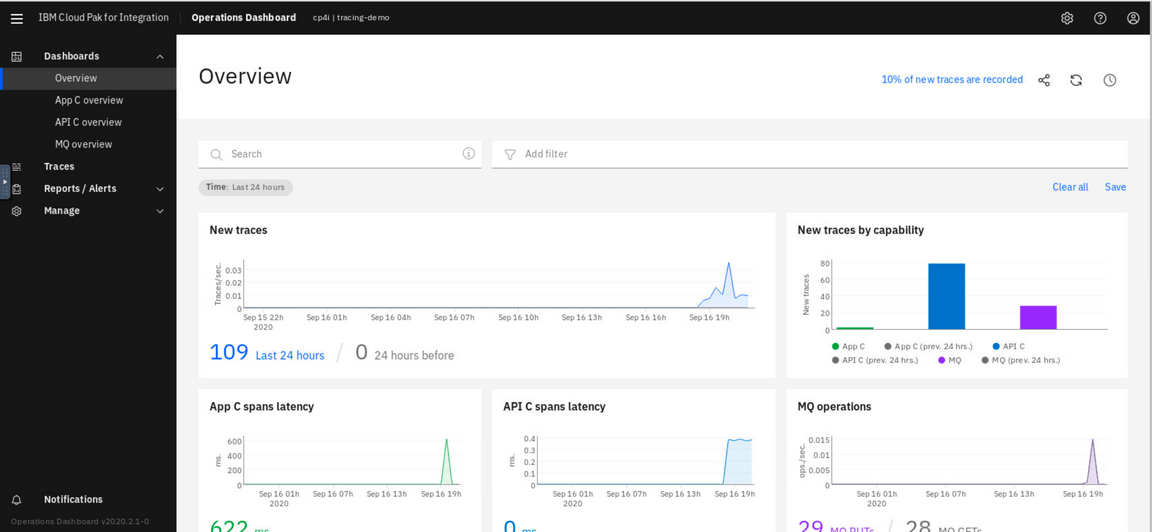
4.Let’s see the MQ tracing, click MQ Overview in Dashboard.
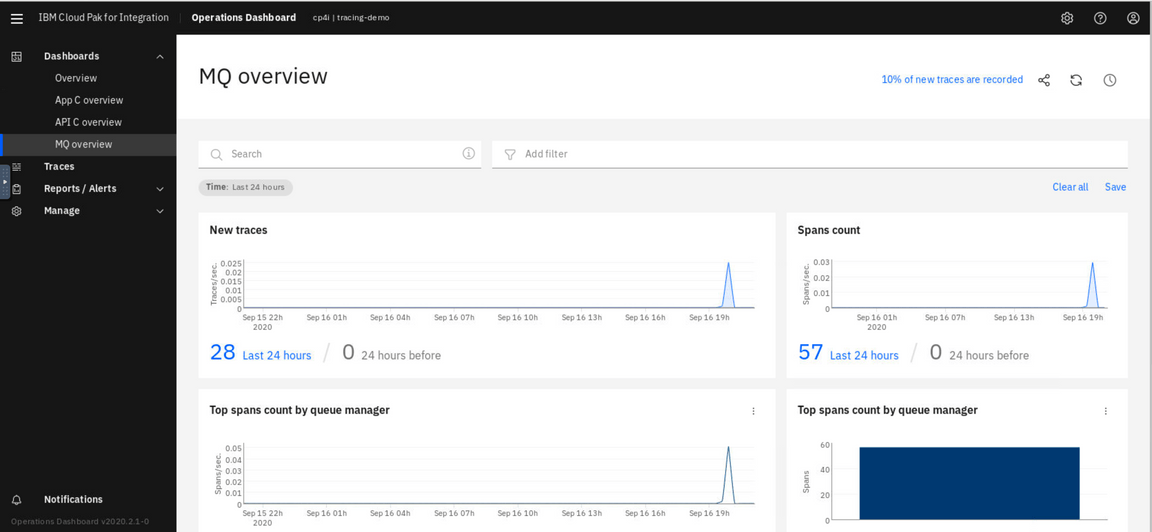
5.You can see App C tracing, click App C Overview in Dashboard.

6.In the tracing page in Dashboards, select Traces the menu on the left.
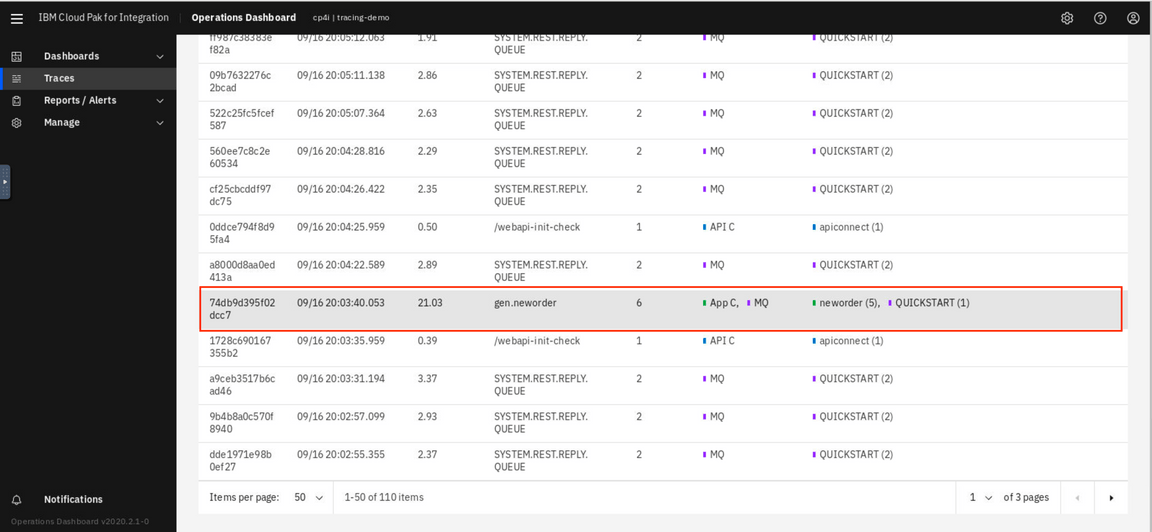
7.Operations Dashboard generated a list of tracing. Select a line to analyze the trace of MQ and App Connect Enterprise.
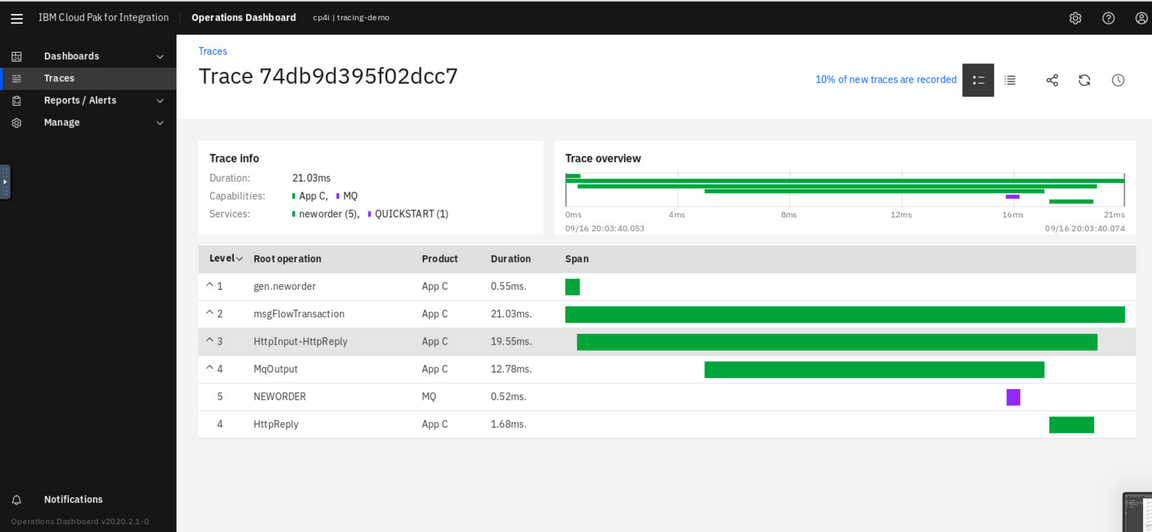
Congratulations!! Here you finished this lab!
Summary
You’ve completed this tutorial. In this lab you learned how to:
- Increase efficiency by creating, testing, and debugging an integration flow with a message queue within a single, unified experience
- Increase scale by deploying integration flows and message queues as containers on Kubernetes.
